IWM (Russell Small Cap, ETF) is the Caboose on the Equity Train, but Perhaps Not For Much Longer
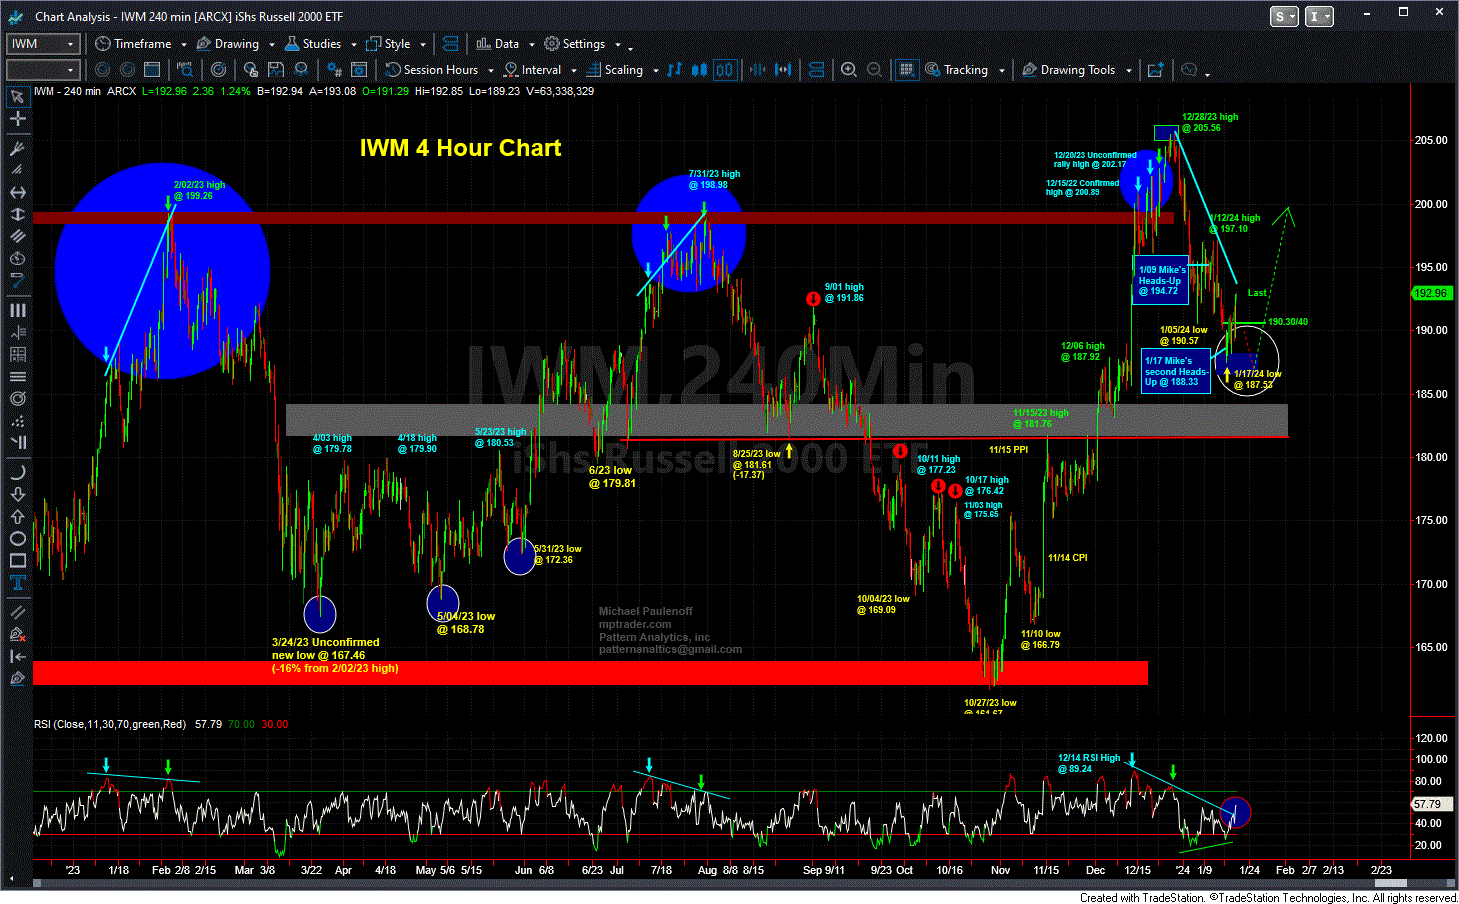
On the morning of January 9, 2024, with IWM (Small Cap Russell 2000 ETF) trading at 194.72, this is what I discussed with MPTrader Members:
... If IWM cooperates and climbs into the 199.50-201.50 target zone, I am expecting the index to run out of gas and roll over into a secondary corrective down leg that retests and breaks below 190.57, pressing into the 186.50-188.50 target zone to complete the larger correction off of the 12/28/23 high at 205.03... In the event, IWM fails to take out yest's high at 197.02 and nosedives beneath 190.57 (1/05/24 low), the secondary down leg already is in progress... In other words, anyone long IWM here should treat it as a short-term "rental" ahead of another bout of weakness... last is 194.72...
I posted a follow-up heads-up about IWM to our members in the pre-market hours of January 17, 2024:
... we find IWM in pre-market trading hit a low of 188.08 after rolling over from 197.10 last week, which has pressed the ETF into my optimal corrective target zone of 186.50 to 188.50 discussed above (January 9, 2024). It is from this Target Window that my pattern work is looking for signs of corrective exhaustion and a technical upside reversal signal. My Big Picture pattern work argues strongly that the upleg from the 10/27/23 low at 161.67 to the 12/28/23 high at 205.56 exhibits bullish form, and as such, informs me that current weakness represents a Window of Opportunity to enter and/or to add to long positions... Last is 188.33...
Later that same day, added:
IWM has ricocheted from 187.53 (in my optimal corrective target zone of 186.50 to 188.50 discussed in my first post this AM, to 189.93 during the first hour of trading, and is approaching a challenge of my initial Up Turn price zone at 190.30/40, which we need to watch closely as today's session wears on... Last is 188.96...
As it turned out, on January 17, 2024, IWM put in a significant corrective low at 187.53 (in myTurn Window) off of its 205.56 high hit on 12/28/23 (-8.8%), and proceeded to climb into last Friday's closing high at 192.96, a full 2.9% above the 187.53 pivot upside reversal from the Turn Window (186.50-188.50) that I identified for MPTrader members on January 9, 2024 (see attached IWM Chart below).
Although IWM's performance last week of +1.2% lagged the bullish performances of the QQQ (+2.3%) and SPY (+1.8%), my technical setup work and the potential for the Small Cap stocks to lead the bull move if the Fed can "stick an economic soft landing," argue for upside continuation and acceleration into the upcoming Fed meeting on January 31, 2024.
Join me and MPTrader members for our ongoing discussions about the technical and macroeconomic influences on IWM in the upcoming hours and days, as well as about many other index ETFs, individual stock names, macro indices, commodities, and Bitcoin. Last week (a 4-day MLK holiday-shortened week), we discussed in-depth technical and macro commentary about GLD, TLT, CVNA, IWM, FAZ, CAVA, NVDA, LAZ, TEVA, EWW, AMD, AAPL, SOFI, AVGO, DKNG, W, ARKK, TSLA, MARA, NOW, IYT, GOOG, and SPY, in addition to my routine intraday updates on ES (Emini S&P 500 Futures)...

