Will Mike's Technical Setup Work on 10-year YIELD Continue to Provide a Roadmap for Bond and Equity Traders?
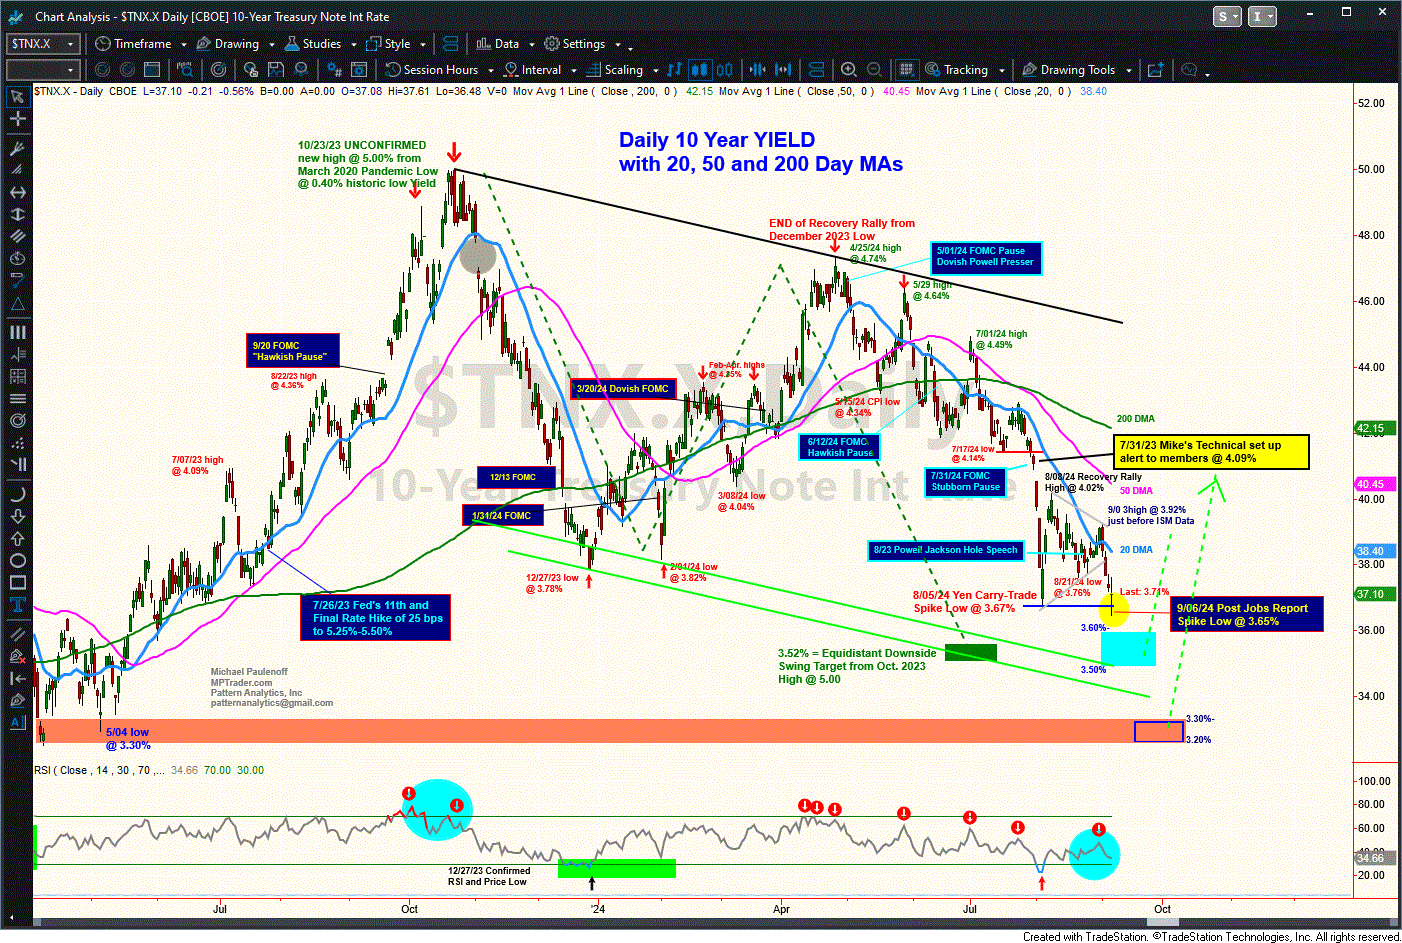
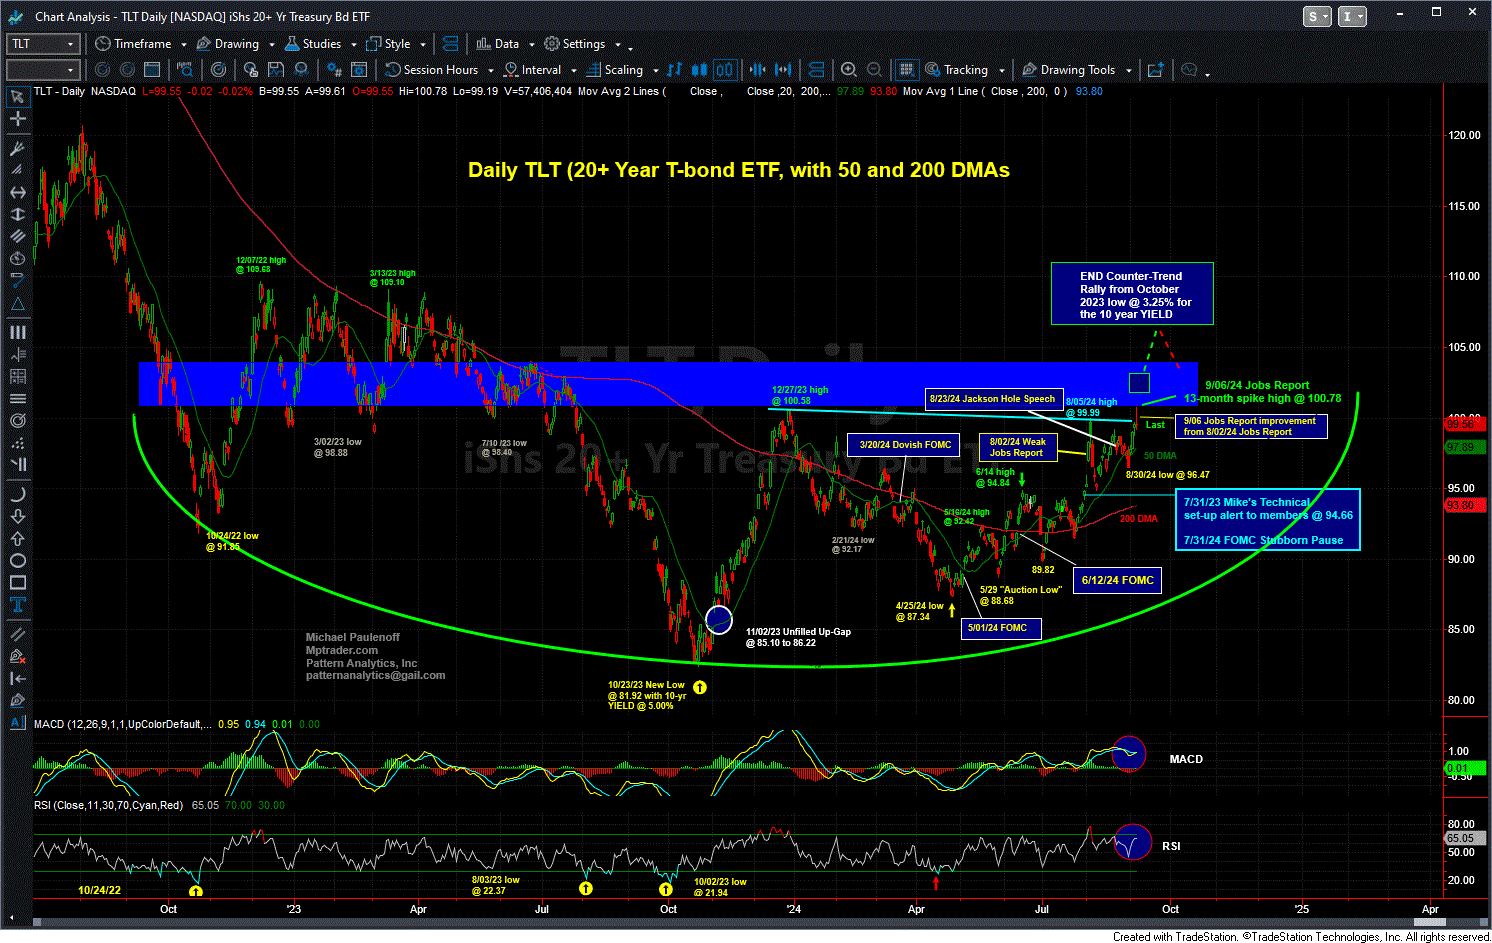
Three hours before the July Fed 31, 2024 (FOMC) meeting, I posted the following chart commentary about my technical setup work on 10-year Treasury YIELD and its actionable longer-term Treasury bond ETF, the TLT (20+ Year T-bond, ETF):
Heading toward Fed Time, 10-year YIELD and TLT (20+ Year T-bond ETF) certainly appear to be anticipating lower interest rate news or innuendos from the FOMC statement (guidance) and Jay Powell in his post-meeting press conference. The technical setups have been hinting about lower longer-term YIELD for weeks now, either because of or despite whatever Powell's challenges are, and more than likely in reaction to a slowing economy that is threatening to derail a soft landing into a much harder one... Last in YIELD is 4.09%... Last in TLT is 94.66... In the subsequent hours, in reaction to the FOMC statement and to Powell's relatively dovish monetary policy tilt at the time, 10-year YIELD plunged to 3.83%, and TLT rocketed to 97.98, or +3.5% during the subsequent 48 hours into the Friday, August 2nd close.
My follow-up August 2, 2024 commentary to MPTrader members said this:
... TLT has thrust out of a 12-month base-accumulation period and pattern that has triggered technical upside potential to the 102 to 107 Target Window. Pullback weakness should NOT break and sustain beneath 95.00 on a worst case corrective scenario... Last is 97.90... As for YIELD, my VERY BIG picture Monthly YIELD setup is "warning us" that YIELD is positioned to press lower-- to break the December 2023 corrective low at 3.78% in route to somewhere in the 3.25%-3.45% Target Window where intense renewed "buyers of YIELD" or sellers into the big price rise since the October 2023 low emerge in force. For now, however, YIELD points lower... and TLTs point higher...
Fast-forward across a dozen subsequent updates from early August through last week's Employment Report for August, helping members navigate market reaction to inflation, growth, and jobs data as well at Fed Chair Powell's Jackson Hole speech, we find 10-year YIELD hit a 15-month low at 3.65% this past Friday (9/06/24), while the TLT climbed to a 13-month high at 100.78, both of which continuing to follow my Big Picture technical setup arguing for benchmark 10-year YIELD to fall to a 3.25%-3.45% target window and in TLT, a climb to 105-107 before I expect severe counter-trend forces to emerge.
What's next for benchmark 10-year YIELD and TLT this coming week as investors and traders anticipate the next round of consequential CPI and PPI inflation data followed by the September 18, 2024 Fed Meeting? Are falling Oil prices and a "deflating stock market" providing clues about forthcoming inflation data and the likely reaction from the Powell Fed after that? Join our members and me ASAP for constant opportunistic intraday discussions about these macro issues and the setups for individual stocks, indices, ETFs, commodities, and Bitcoin... MJP


