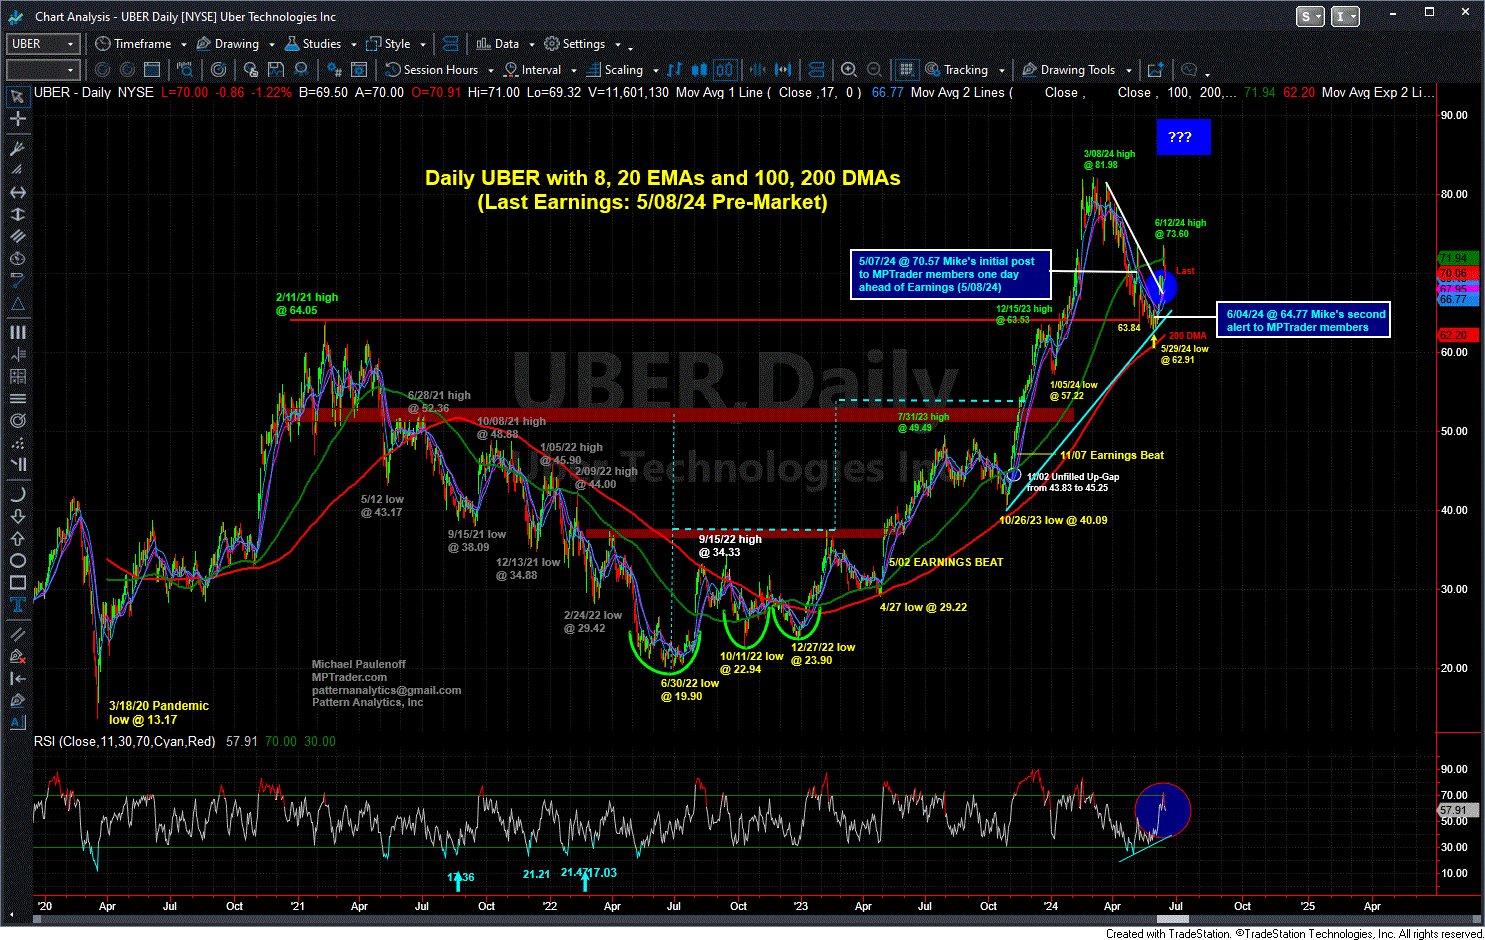
Identfying UBER's Up-Turn Potential After Testing Its Sharply Up-Sloping 200 DMA
On the afternoon of May 7, 2024, ahead of earnings the next morning, this is what I discussed with MPTrader members about a forthcoming opportunistic technical set in UBER (Uber Technologies):
UBER reports earnings tomorrow morning before the opening bell. My Big Picture setup suggests strongly that the bull phase that commenced in June 2022 at 19.90 still has unfinished business on the upside into the 90-100 target window. This is not to say that the reaction to tomorrow's earnings report will propel UBER to 100, but admittedly, my attached Big Picture chart set up argues that the March-May 2024 pullback of 20% looks complete, and if so, means that UBER is poised for a powerful new upleg that should retest the March high at 81.98 in route to 90 as a next optimal target level. Only a very disappointing report that triggers sell programs that press the stock beneath last Wed.'s low at 65.86 toward a confrontation of the up-sloping 200 DMA, now at 59.36 will force UBER to carve out a new, lower corrective bottom ahead of the next upleg... Last is 70.57...
As it turned out, UBER investors reacted negatively to earnings, pressing the stock from its 5/07/24 close at 70.43 to 63.84 in the hours immediately following the news, and lower still in the subsequent two weeks, declining into the 62.90-63.40 area in a multi-session probe of the sharply up-sloping 200 DMA.
Fast-forward to my heads-up to MPTrader members on June 4, 2024, with UBER trading at 64.77:
UBER has spent the past 6 sessions probing and bouncing off of the vicinity of its up-sloping 200 DMA (61.21), which has triggered a potential upside reversal signal in my work. As long as any forthcoming weakness in UBER is contained in or above the 61 to 63 support zone, my pattern work indicates that the 23% decline from the 3/08/24 high at 81.98 to the 5/29/24 low at 62.91 is complete ahead of the emergence of EITHER a new upleg that projects above 82.00, OR a powerful recovery rally to the 74-77 resistance zone... Last is 64.77...
The rest as they say is history. UBER never looked back after June 4th. The price structure pivoted to the upside off of a cluster of corrective lows that qualified as an intense, successful test of the 200 DMA into a powerful advance (see my attached Daily Chart) that subsequently climbed above the March-June resistance line in the vicinity of 67.60 to last Wednesday’s (6/12/24) recovery rally high of 73.60—a full 13.6% gain from my 6/04/24 heads-up to MPTrader members and 4% above where UBER was trading on the day before earnings.
Where does UBER go from here? Is the vertical upmove off of the 5/29/24 pivot low at 62.91 the initiation of a new upleg within its two-year bull phase, or a bout of strength within a still-dominant post-March corrective-digestion period?
Login to join Mike and MPTrader members today, ahead of this week's opportunistic technical and fundamental intraday discussions about UBER and many other individual stocks, sector ETFs, macro indices, commodities, precious metals, and Bitcoin.

