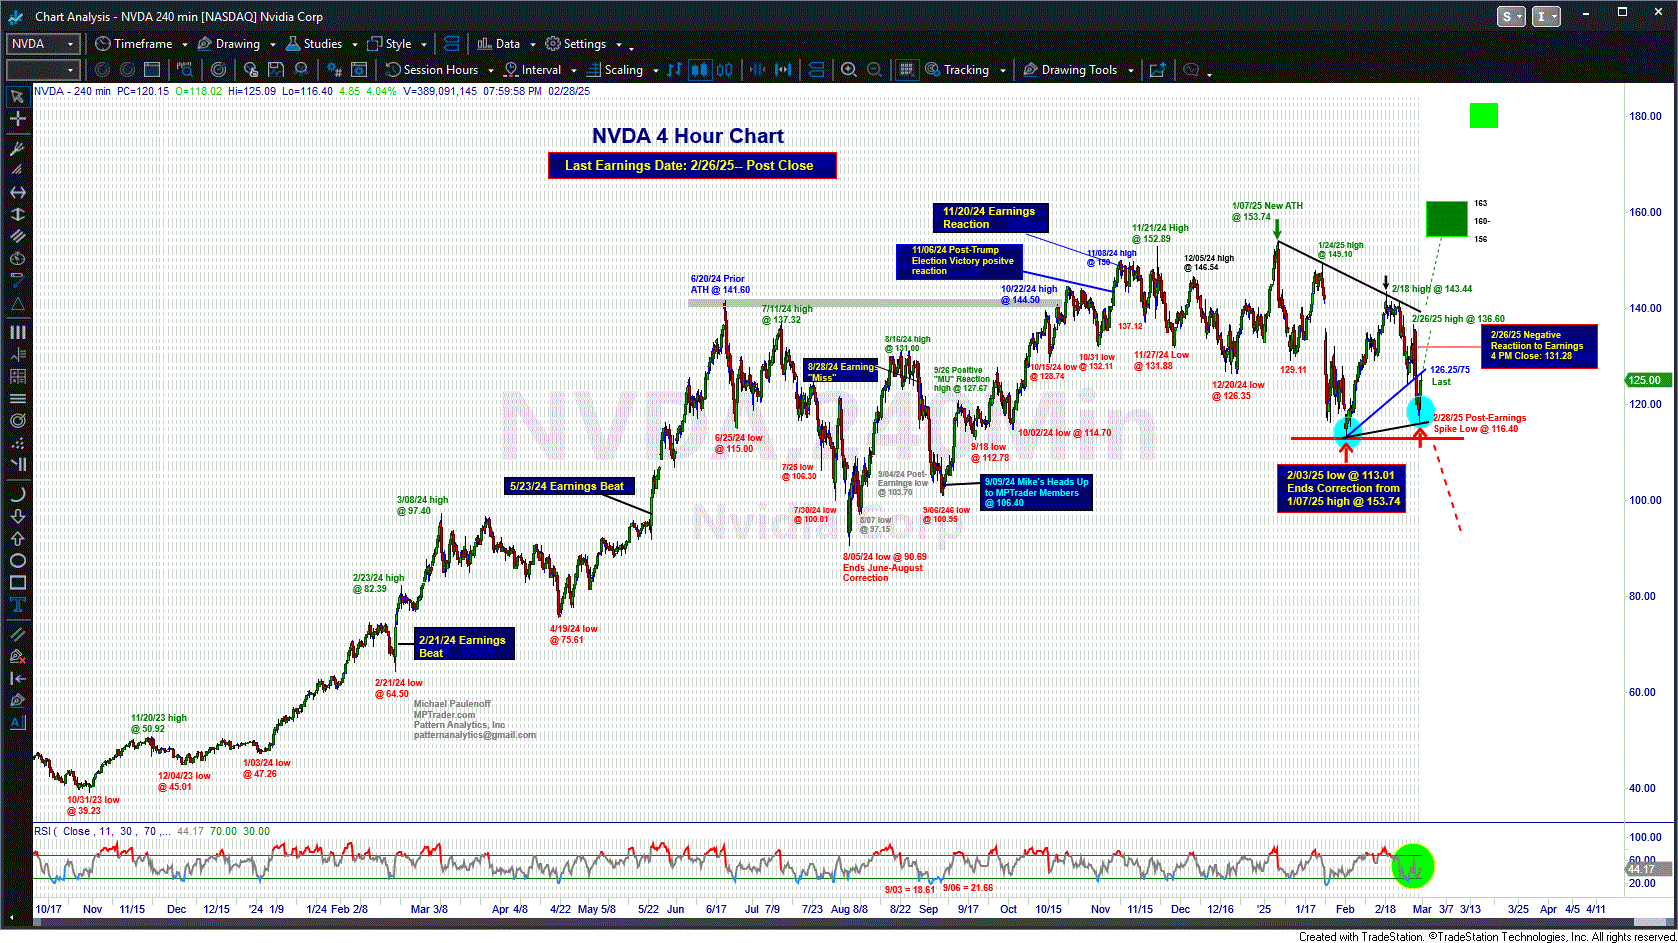
On February 26, 2025, just 30 minutes before NVDA (Nvidia Corp) was scheduled to release its highly anticipated and potentially consequential Quarterly Earnings Report, I reiterated my most recent analysis uploaded before the opening bell. This is what I posted to the MPTrader Discussion Room:
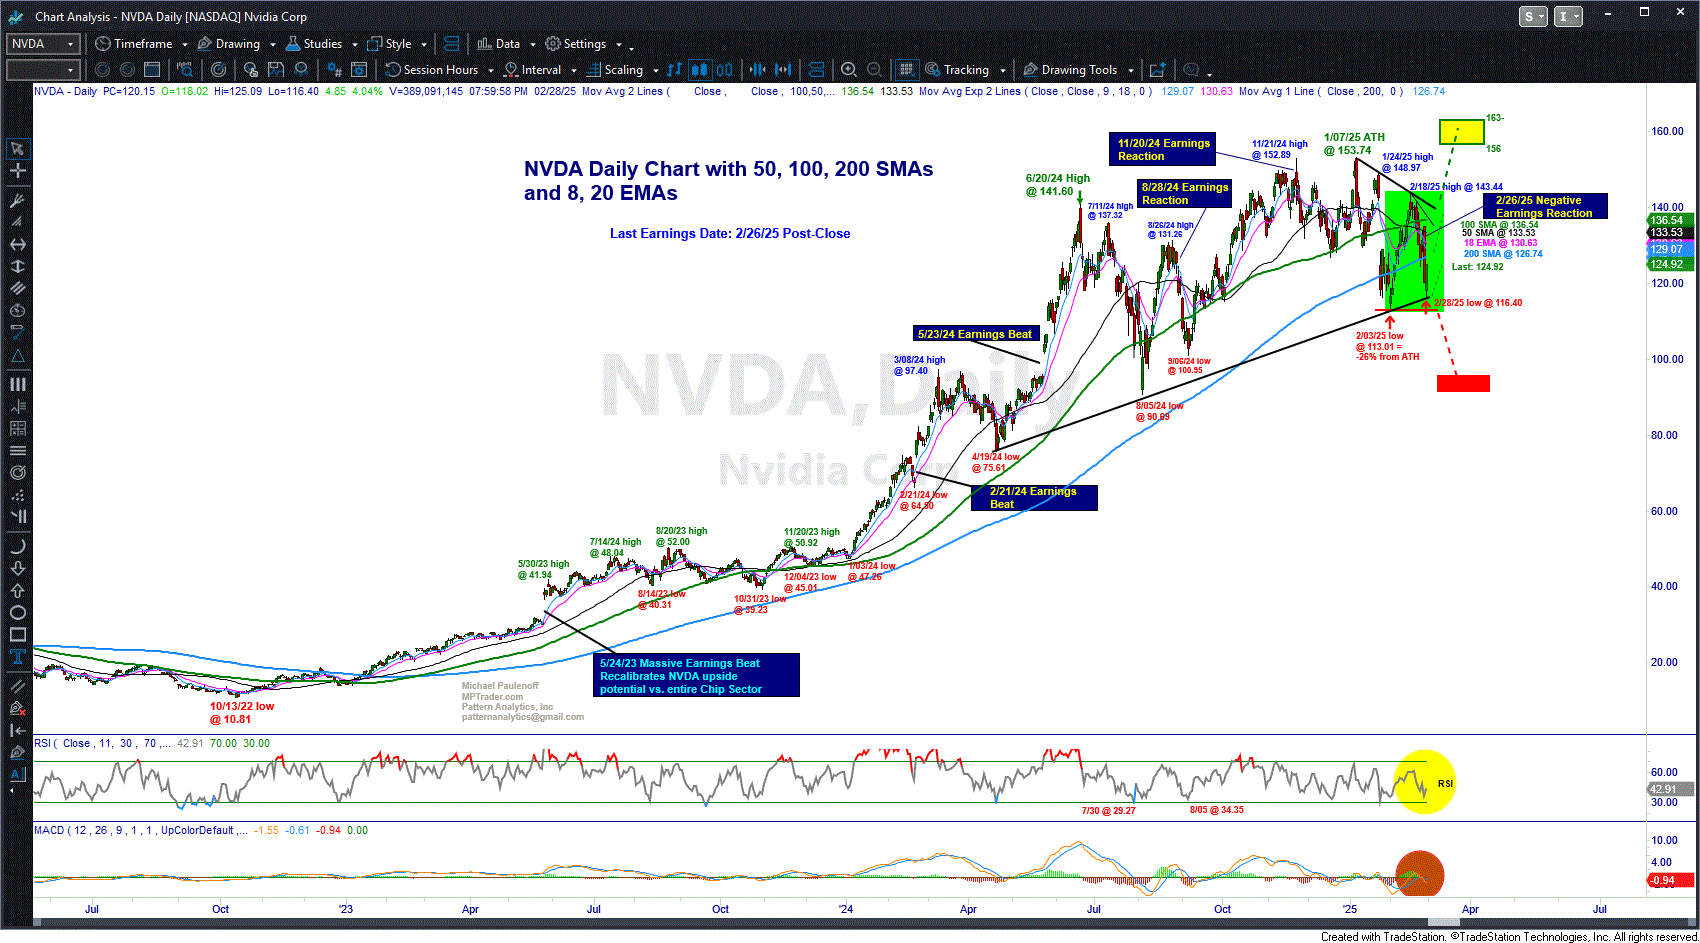
Technically, my Big Picture setup work on NVDA argues that the 2/03/25 low represented the END of a major correction that originated at NVDA's "orthodox" price high of 152.89 on 11/21/24-- the session following the company's November 20, 2024 Earnings report. Furthermore, my pattern work indicates that the rally from the 2/03/25 corrective low at 113.01 to the 2/18/25 high at 143.44 exhibited bullish form (annotated in bright green on my attached Daily Chart), and as such, I am treating that rally as the first upmove of a new upleg in NVDA that is destined to climb to new ATHs above 153.74 to a minimum next target zone of 156 and an optimal target of 163. Only an acutely negative reaction to Earnings, Conference Call, or CNBC interview with CEO Jensen Huang that nosedives NVDA beneath 113.01 will invalidate my preferred bullish scenario... Last in pre-market trading is 129.51... My pattern analysis remains unchanged (from 9 AM ET)... Last is 131.70 at 3:56 PM ET...
In the immediate aftermath of Earnings, NVDA churned around unchanged (131.28), but during the following two sessions (Thursday and Friday, 2/27/25 and 2/28/25), NVDA nosedived beneath key nearest support at 124-125, which put my line-in-the-sand pivot low of 113.01 into the sellers' crosshairs for a potential technically critical test.
Fast-forward to Friday morning. NVDA pivoted off a "retest low" at 116.40, thereafter, rallying for the remainder of the session to close last week at 125.00.
Now what? Is NVDA out of the woods technically after it survived a retest of the 2/03/25 low at 113.01?
While I can make a compelling argument that Friday's PM upmove from 116.40 to 125.07 exhibited bullish form that imbues my analysis with budding confidence that NVDA established a significant corrective February Double Bottom Low ahead of a resumption of its intermediate and longer-term bull phase, my pattern work indicates that a sustained climb and close above 127.40 will trigger confirmation signals that NVDA is in the grasp of a new upleg that at the very least will challenge consequential resistance from 140 to 143.45 that if (when) taken out will project upside continuation and acceleration to new ATHs above 153.74 (1/07/25)...
Only a failure to close above 127.40 and/or a sharp downside reversal from at or below 127.40 that nosedives NVDA below the February low-zone from 113.00 to 116.40 will invalidate my bullish scenario...
Join me and MPTrader members ASAP for an exciting week ahead for NVDA as well as for many individual stocks and sectors, ETFs, commodities, precious metals, and Bitcoin during a period of POTUS' potential imposition of tariffs on China, Canada, and Mexico, Tuesday evening's State of the Union Message, and another tranche of telling Earnings from major players in the tech space and from big box retailers... MJP