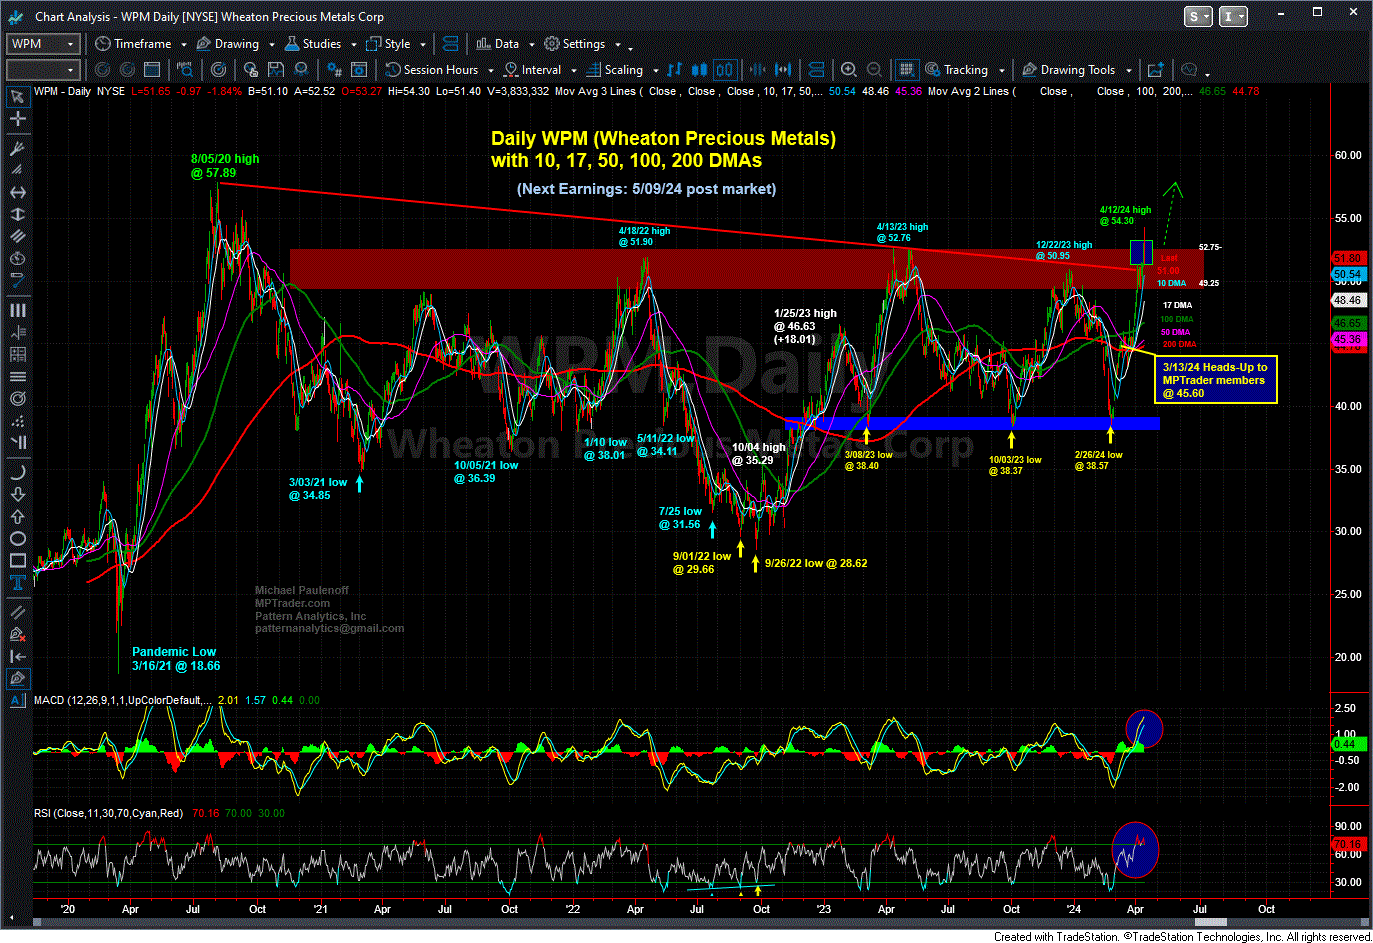
Anticipating The Rally In Wheaton Precious Metals

by Mike Paulenoff
April 14, 2024 • 12:03 PM EDT
On March 13, amid a broad discussion about the emerging bull phase developing in the precious metals and miners, Mike Paulenoff posted this about WPM (Wheaton Precious Metals) to our MPTrader discussion room:
From a more Silver-Gold perspective (if FCX is perceived to be Copper-centric), let's notice that WPM strength is pushing up against its near-term resistance line in the vicinity of 45.80, which if taken out and sustained, will point WPM toward a challenge of its 4-1/2 year resistance line that cuts across the price axis at 51.00... Last is 45.60...
Mike followed up with a note on the afternoon of April 3:
WPM (Wheaton Precious Metals) is knocking on the door of a near 4-year upside breakout zone from 51.00 to 52.80, which if (when) taken out, will project an intermediate-term target zone of 60-62. Any forthcoming weakness into the 48.60 to 47.00 support area should attract major buying interest-- if it gets back down there... Last is 50.43...
Last Thursday-Friday (April 11 and 12), WPM thrust above Mike's initial target of 51.00, hitting a 3-1/2 year high at 54.30, a full 19% above the initial heads-up at 45.60.
That said, however, WPM sold off 4.5% in sympathy with many risk-on assets late Friday ahead of a weekend fraught with greatly heightened geopolitical uncertainties, closing at 51.80.
What does Mike's work tell him about the technical setup in WPM as well as the precious metals complex going forward? Will the geopolitical risk-premium continue to be a factor supporting prices? What influence will a Fed reluctant to cut interest rates have on gold and silver? And what about the US Dollar's position vis-a-vis the precious metals?
Login this week to join Mike and MPTrader members for their discussions about the issues mentioned above and how the various scenarios might impact the precious metals and miners, and as earnings season kicks in again, the setups in individual stocks, S&P sector ETFs, macro indices, Treasury bond and Energy ETFs, as well as Bitcoin.

Never a dull moment since January 20, 2025! This weekend, POTUS imposed 25% tariffs on Mexico and Canada, and 10% on China, which go into effect on Tuesday. From an initial market perspective, tariff trade war fears have triggered a risk-off reaction from Bitcoin-- the only highly liquid weekend market that can give us insight into what to expect for Sunday evening and Monday morning trading.
On December 27, 2024, with META trading at 595.26, this is what I posted to the MPTrader Discussion Room in response to a member's question:My pattern work from the October 2023 low at 279.40 to the December 2024 ATH at 638.40 (+128%) tells me that META is at a technical crossroad now... META's most recent upleg from the 11/19/24 low at 547.71 to the 12/11/24 ATH at 638.40 has the "right look" of a completed advance.
At the close of trading on December 18, 2024, this was my final thought posted to our discussion room at MPTrader.com:ES (March 2024 E-mini SP 500)-- Stating the obvious: Today's reaction to the FOMC Rate CUT (!!) inflicted serious near-term technical damage to the dominant, post-August uptrend... Last 5960.75...Thirty minutes after the close on December 18, 2024, I followed up with this commentary for MPTraders:My preliminary "conclusion" about today's outsized 3.
On December 20, 2024, this is what we discussed about the relentless four-week correction from NVDA's ATH at 152.89 (11/21/24) to a low at 126.35 on 12/20/24:Three Times is a Charm? For the third time this week, NVDA spiked down into the lower reaches of my optimal corrective target window from 132 to 125-- this AM representing the latest spike low at 126.35-- and for the third time, buyers emerged, propelling NVDA higher to 130-132. As we speak, NVDA is trading at 131.
On December 13, 2024, with NVDA trading at 132.54, down 13.3% from its All-Time High at 152.89 (11/21/24), and bearing down on a critical 8-week support plateau at 131-132, this is what I posted to MPTraders:NVDA Update: Approaching key support in the vicinity of 132 that if violated and sustained, could unleash the downside potential derived from a two-month top formation (everyone sees the Head and Shoulders formation by now).

