Anticipating Continued Weakness In TLT
This past Tuesday morning, August 8, Mike Paulenoff responded to a concerned statement from one of our MPTrader members about the TLT (20+ Year T-bond ETF) possibly having turned up in a significant way, especially if weak China data and an "off-sides" crowded hedge fund short position in bonds gets scared (and runs to cover its shorts).
Mike wrote: "I certainly cannot argue with his logic, but there IS a huge amount of Treasury paper for sale this week (not exactly a surprise, however) right into Thursday AM's CPI report. And then, of course, we have the powerful climb in Oil prices (gasoline), which at some point, will slow consumption and put the soft or hard landing scenario back on the table. That said, what is the technical setup in TLT telling us? At the moment, it is warning me to continue to be open-minded to additional weakness in the TLTs (further rise in long rates) that revisits the October 2022 lows (high in rates), and that the dominant TLT downtrend will remain intact unless and until TLT manages to climb above heavy, consequential resistance lodged from 97.70 to 100.00 (see my attached 4-Hour TLT Chart). At the moment, I will let the price action of the TLTs dictate my action reaction in the upcoming days... Last in TLT is 96.89..."
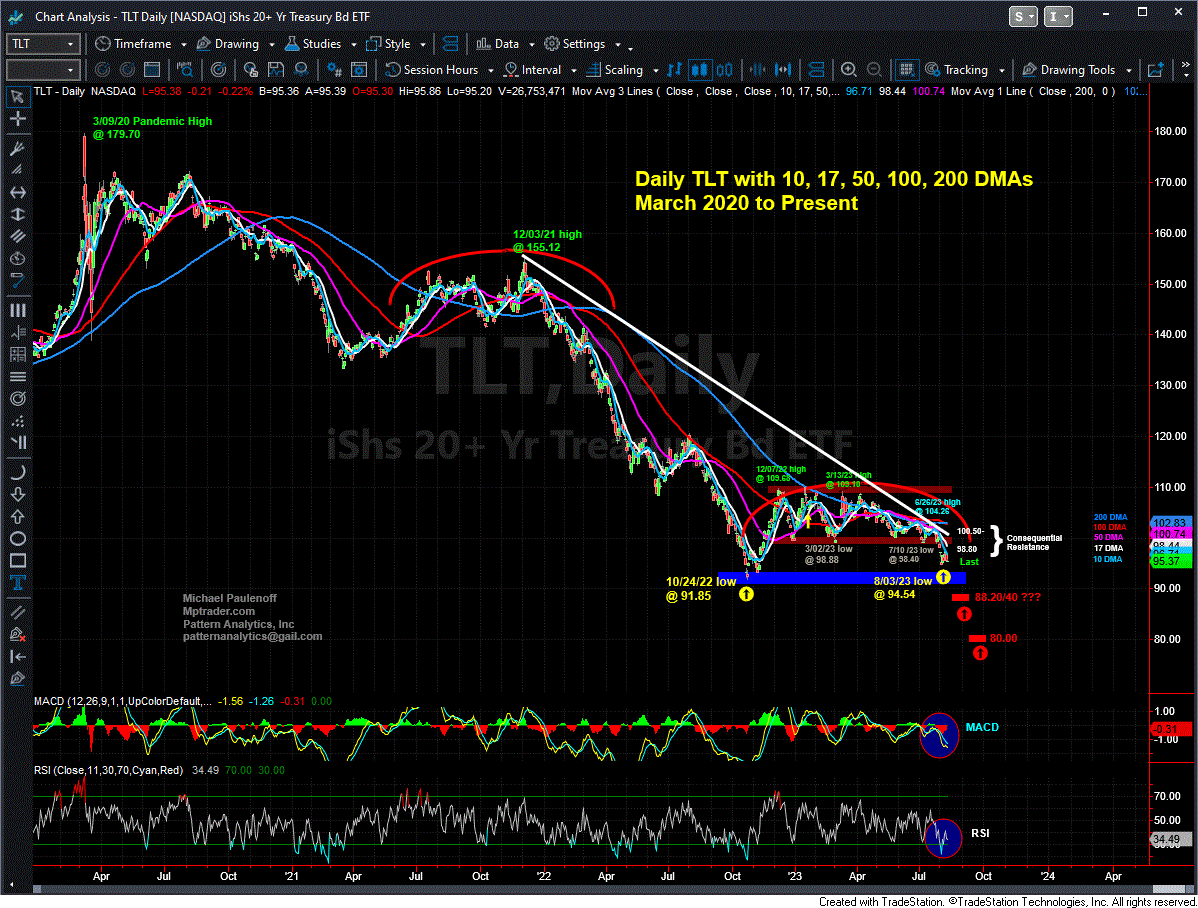
Fast-forward to the end of last week, we see that despite relatively weak economic (and disinflationary) data on Mortgage Applications, CPI, Jobless Claims, PPI, and Consumer Sentiment, and surprisingly weak China data, that the TLT pressed to a new 10-month low at 94.54 -- down 2.4% from Mike's alert -- and settled on Friday at 95.37.
One thing is apparent: The bond market is concerned with something other than the year-long disinflationary trend in official inflation data and the implications for global growth implied by a very sluggish Chinese economy.
What comes to Mike's mind as a possible culprit is the huge Treasury supply that has come and will continue to come to market during the second half of 2023, which in and of itself indicates that fiscal (deficit) spending is motoring along at a rapid pace that is worrying bond investors worldwide. Additionally, there is worry in the fixed-income markets about the relentless two-month climb in Oil prices from (roughly) $63/bbl to $85/bbl, which could be a warning shot over the bow that inflation will return with a vengeance in the near future.
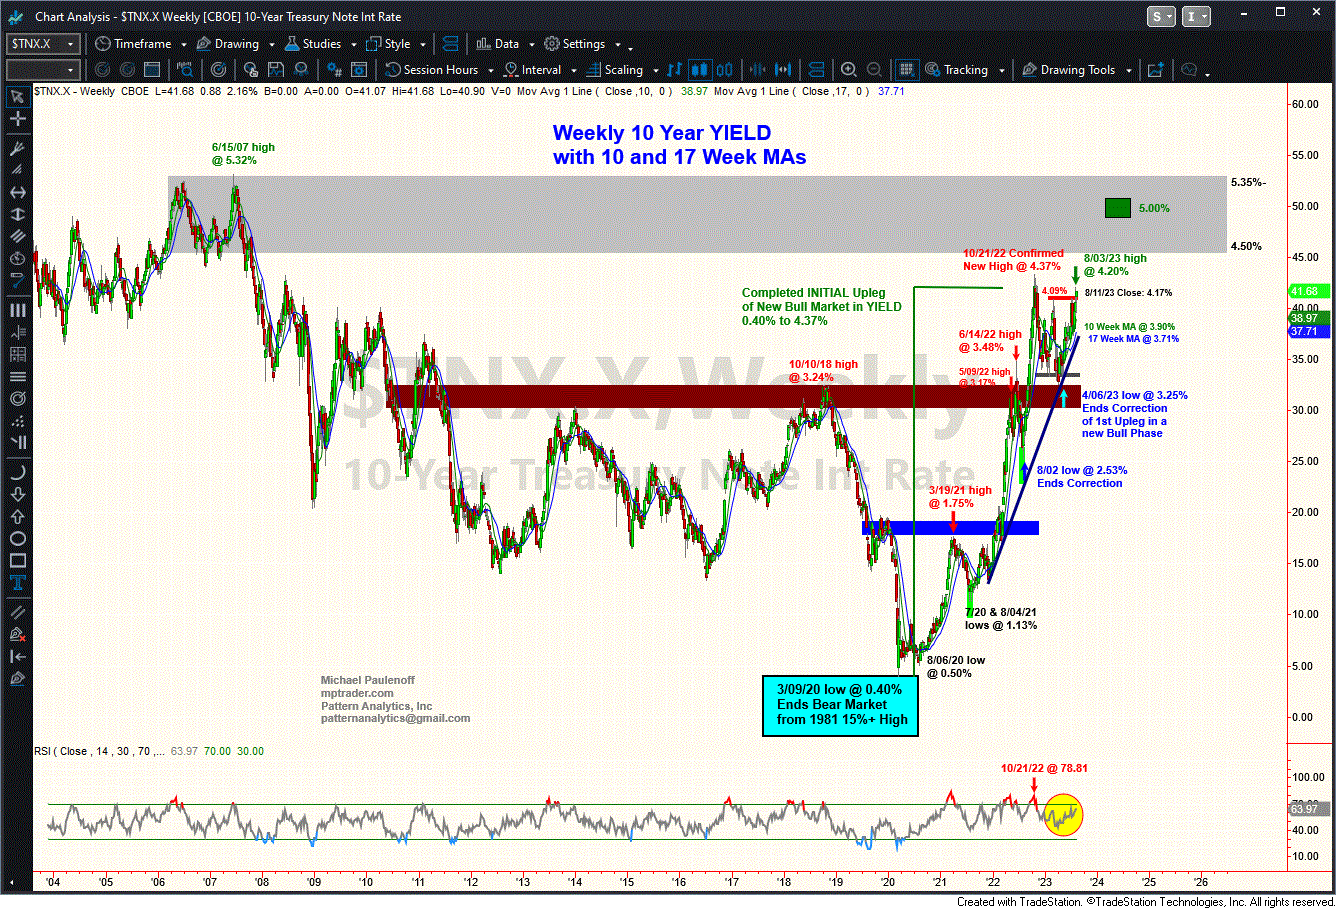
Whatever the "underlying reasons," the technical setups on Mikes intermediate-term work in TLT and on 10-year Benchmark YIELD (see the attached charts) suggest strongly that the longer end of the curve is at an inflection point. If the dominant downtrend in TLT and the dominant uptrend in 10-year YIELD fail to reverse sharply in the upcoming days, both trends will continue and accelerate into the Fed's August 25th Jackson Hole Meeting.
Login this week to join Mike and our members in the MPTrader Discussion Room (the Daily Diary), for our opportunistic conversations about the technical setups and fundamental drivers in the TLTs, as well as many individual stocks, sector ETFs, Macro Indices, Commodities, and Bitcoin.


