Will Fed Overstay Their Welcome? Plus, Chart on Yield
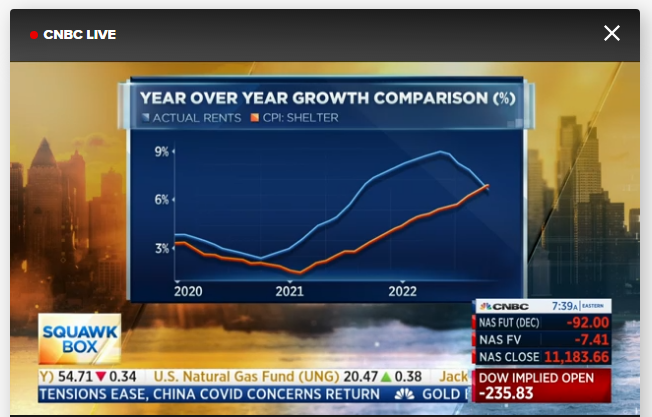
Thursday, November 17, 2022-- Mptrader Pre-Market Update: Barry Sternlicht, CEO of Starwood Hotels, moonlights as an insightful, smart macroeconomic "analyst" because his business gives him access to lots of data, exhibited several slides showing economic data during his CNBC interview this AM. The slide below of the largest factor within the CPI, the Shelter Component is interesting and an eye-opener. The Red Line shows the "official" government treatment of "rental" costs, which is a lagging series in the government's data collection process, whereas the Blue Line shows the actual path of rental costs. For the past several months, rents have rolled over and declined at a rapid pace, suggesting strongly that if the government's data series was more time-sensitive, headline CPI reported by the BLS would be decreasing significantly faster than the Fed will have us otherwise believe. In that, the Fed still remains in hiking mode into year-end, intent on pushing the Fed funds to 5%-5.25% (currently at 3.75%) runs the very real risk of Jay Powell overstaying his welcome and thus, inflicting damage to the economy in the upcoming months (hard landing?).
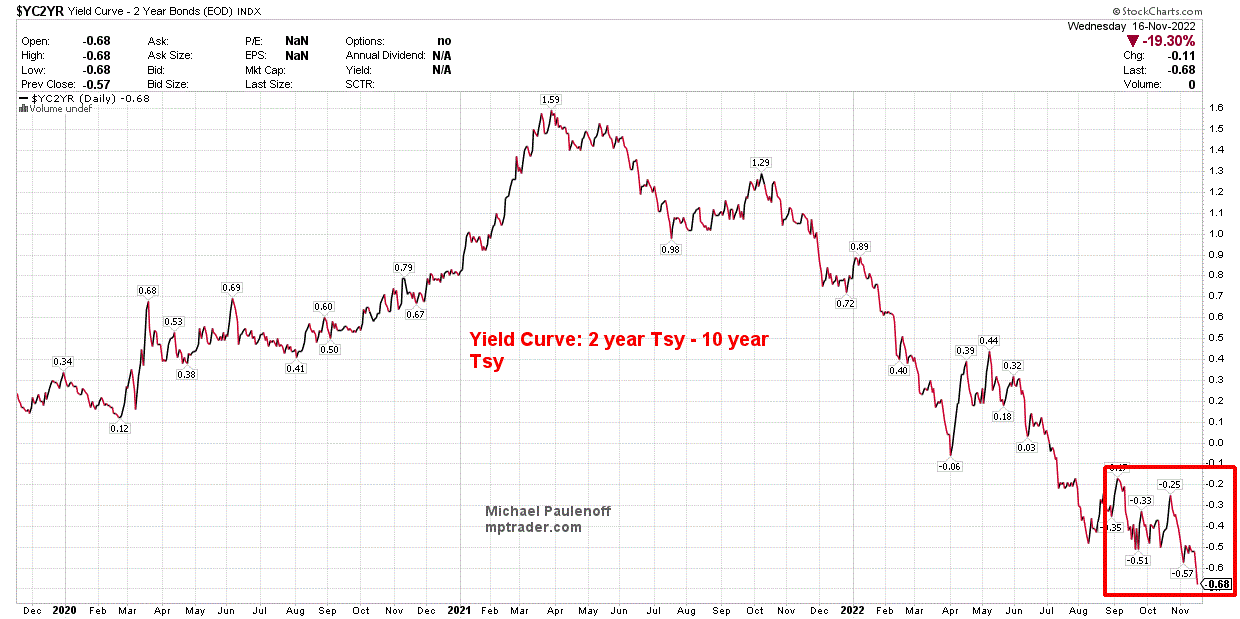
My attached chart of 10-year YIELD minus 2-year YIELD (2s-10s Yield Curve) is the most negative since the late 1970's, even more negative than during the initial period of the Great Financial Crisis, which corroborates Sternlicht's CPI comparison chart... No wonder the TLT (20+ Year T-bond ETF) is acting mighty buoyant lately... Food for thought on this Thursday morning... MJP


