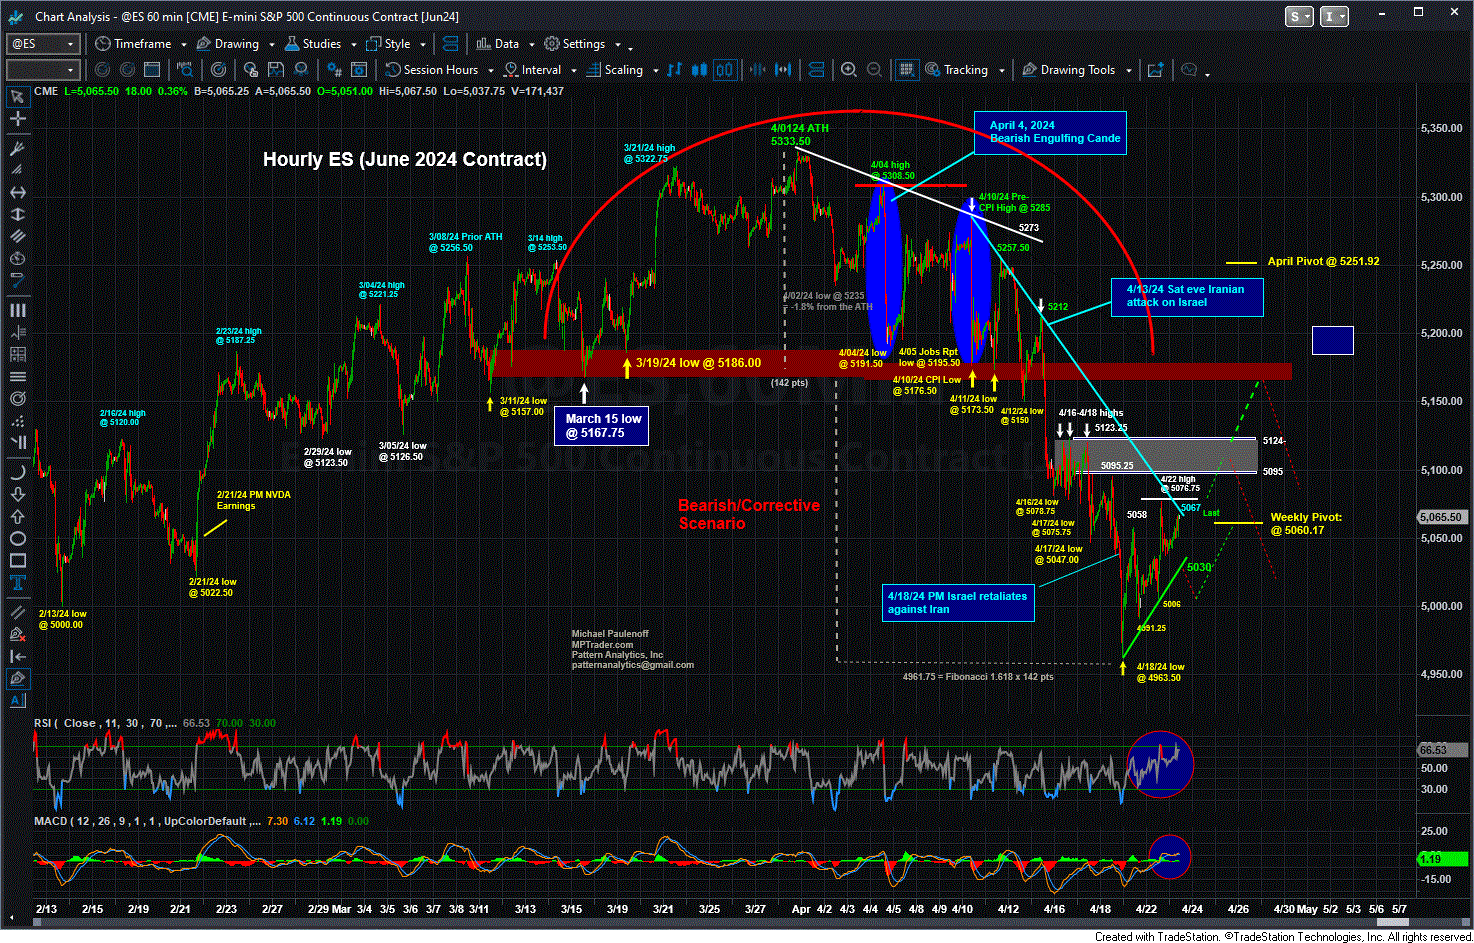
Volatile Swings Within ES Recovery Rally
Good Tuesday Morning, MPTraders! April 23, 2024-- Pre-Market Update: ES remains in the grasp of a recovery rally off of last Friday's lows, but the price path so far has been anything but a straight-line advance.
My attached Hourly Chart of ES shows the volatile swings within the recovery rally from Friday's low at 4963.50 to yest's high at 5076.75 (+2.3%), which my pattern work indicates represents the first stage of a still-developing recovery rally period that projects EITHER to 5095-5125 OR to 5150 to 5170 to test last week's breakdown plateau.
The $64,000 question is whether the second stage of the recovery rally already is in progress after yesterday's late-session swoon from 5076.75 to 5036.25 (last is 5065.25)?
My inclination is to wait for a run above yest's high at 5076.75 to answer "yes," or alternatively, to look for another swoon to test intraday support at 5030 or 5005-5010, from where my pattern work will expect the next U-Turn to the upside (see my attached hourly chart).
As of this moment, ES is attempting to challenge nearest resistance at 5065-5076.75, which if taken out will trigger a run at 5095-5124... Last is 5065.00
FYI-- TSLA reports earnings after today's close (we will review the technical setup later this AM)...

