The Final Fed Meeting During 2023 Finally Arrives! How will Investors and Markets React to the News?
Everyone will be scrutinizing Chairman Powell for clues about the prospects for a soft landing and the timing of the first rate cut, but what matters most is the messages implied by the chart setups...
Recall in my prior two articles (on Substack) that we discussed whether or not the near-vertical 10%-12% rally in the Cash SPX (S&P 500) had developed conditions and was approaching resistance levels more powerful than the inertia created by the rally itself, capable of repelling additional strength and reversing SPX direction. In both prior instances, I concluded (so far correctly) that the SPX still had room to climb.
What about now, on the day of potentially consequential news from the Fed? Let’s take a look…
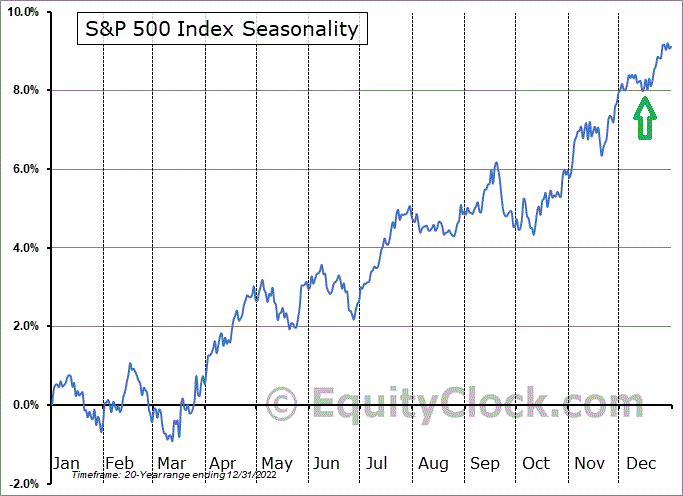
First of all, let’s be aware that since about the year 2000, in and around mid-December, the Cash SPX historically has pivoted to the upside into a strong advance that lasts into the first week of the following year (see the attached Seasonal Chart). As fate would have it, give or take a day or so, the timing is right for seasonal upside acceleration, depending on what the Fed does and says later today…
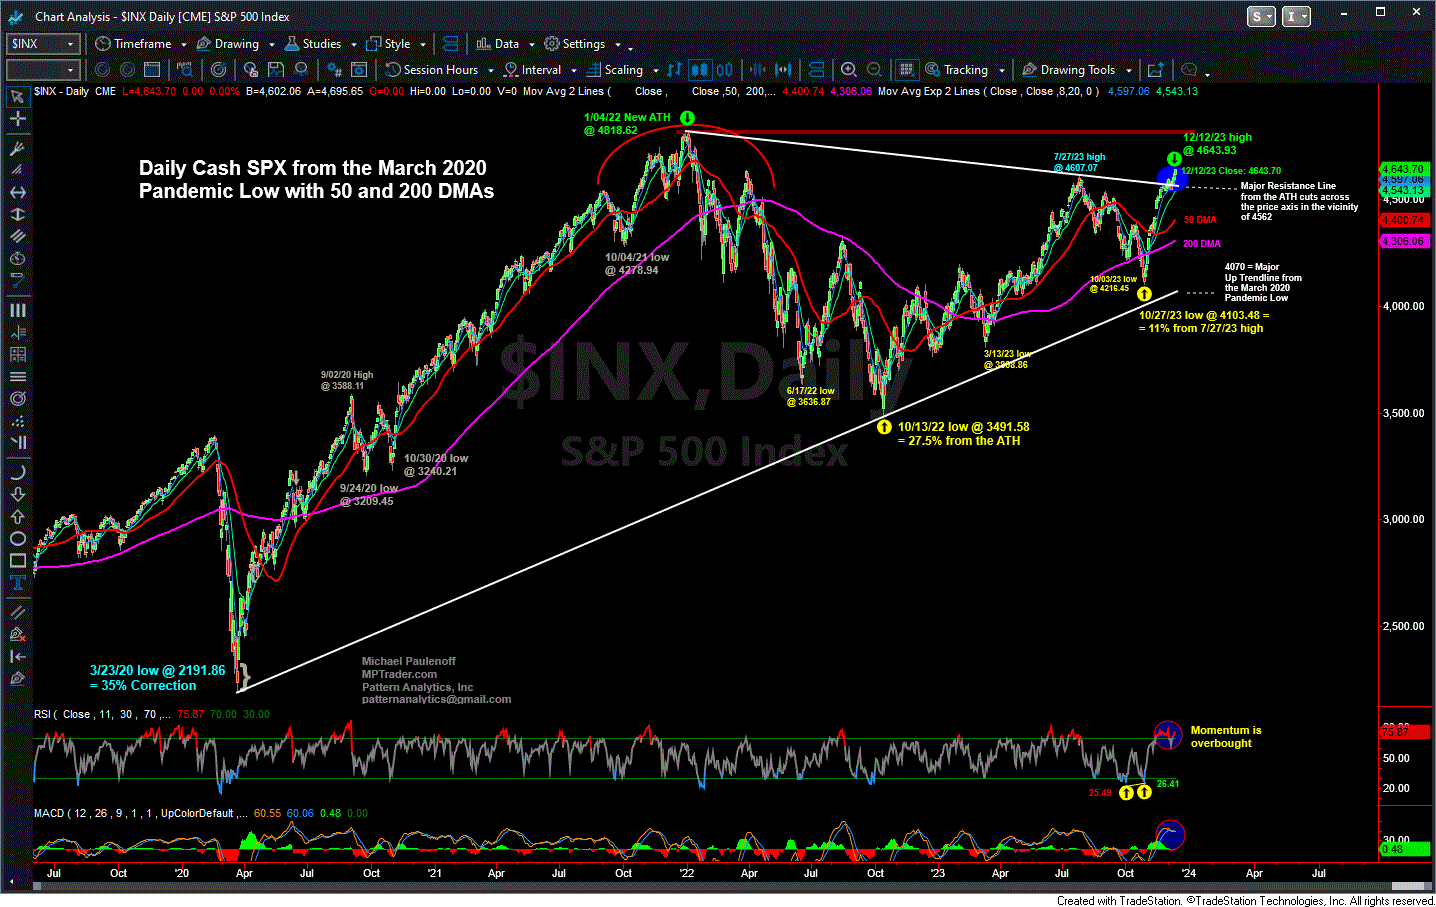
With a potentially strong seasonal underpinning market direction for the remainder of December, let’s notice on my attached Daily Chart that the Cash SPX currently is trading 1.8% ABOVE its 23-month dominant resistance line (formerly a candidate for an immovable force in my prior articles) and poised for still-higher price levels that point next to a challenge of the January 2022 All-Time High-Zone from 4750 to 4820. Barring a very disappointing reaction to whatever the Powell Fed does and says today that reverses SPX to the downside beneath 4550/60, triggering sell signals in my work, the setup in SPX otherwise argues for upside potential of 2% to 4% from current levels before alarm bells start ringing (12/12/23 Close: 4643.70)…
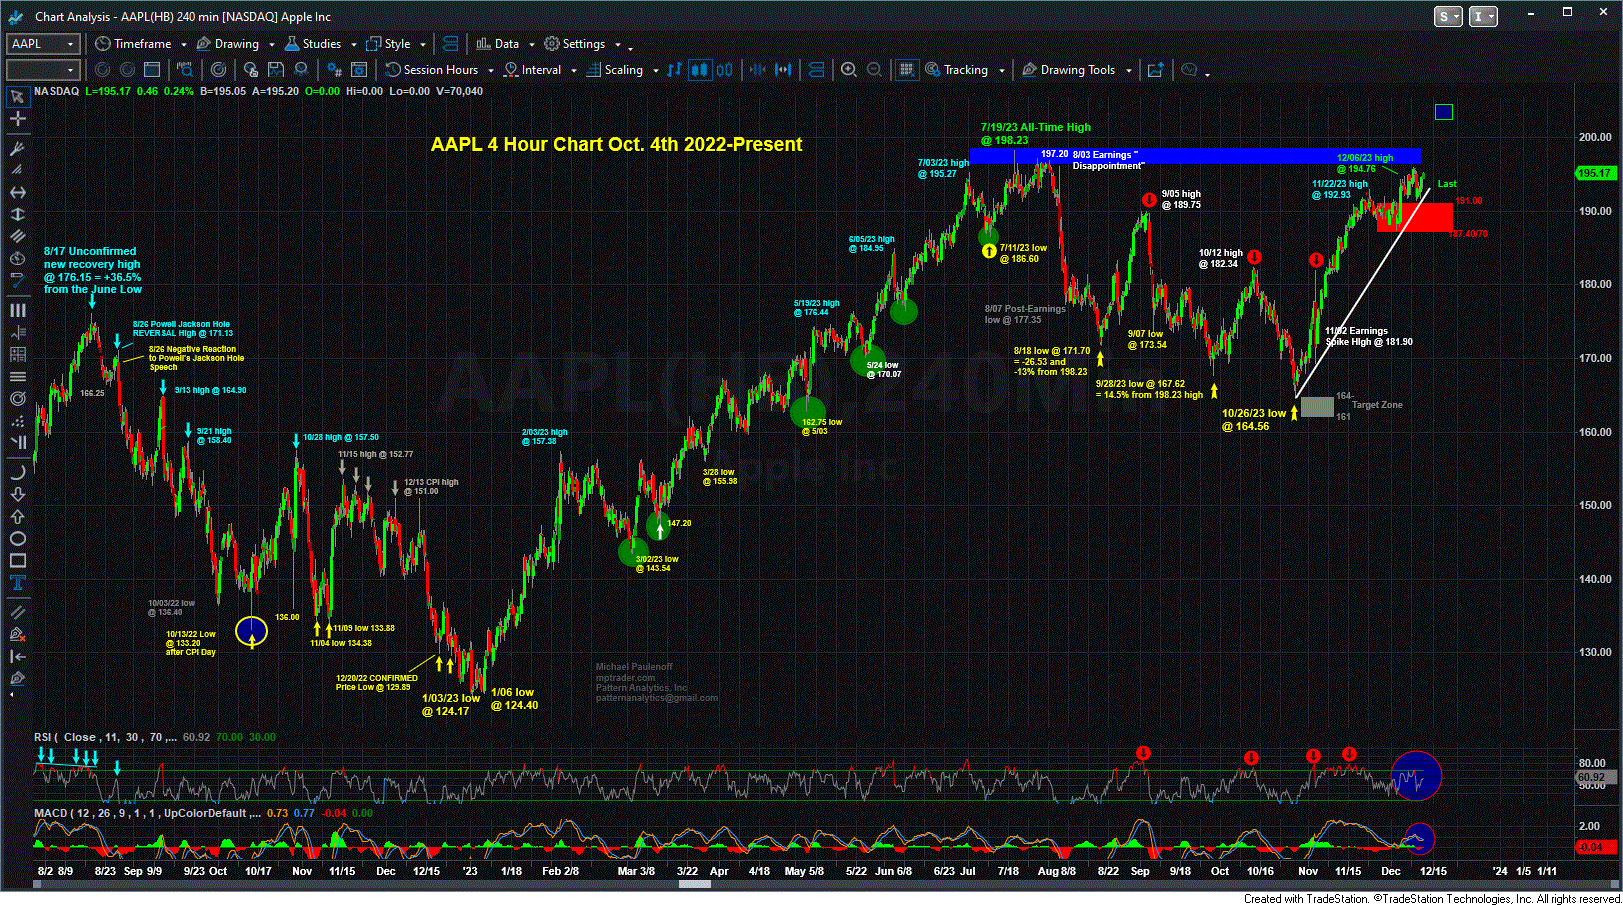
AAPL for example— one of the Magnificient 7— remains in the grasp of its post-10/26/23 uptrend from 164.56 to 195.79 (+19%), and as we see on my attached chart, is poised for upside continuation to challenge its July 2023 All-Time High-Zone from 197.20 to 198.20, that if (when?) hurdled will trigger higher projections into the 203-206 area next. Only a bout of weakness that presses AAPL beneath key support from 191.00 to 187.40 will inflict serious damage to the post-October advance…
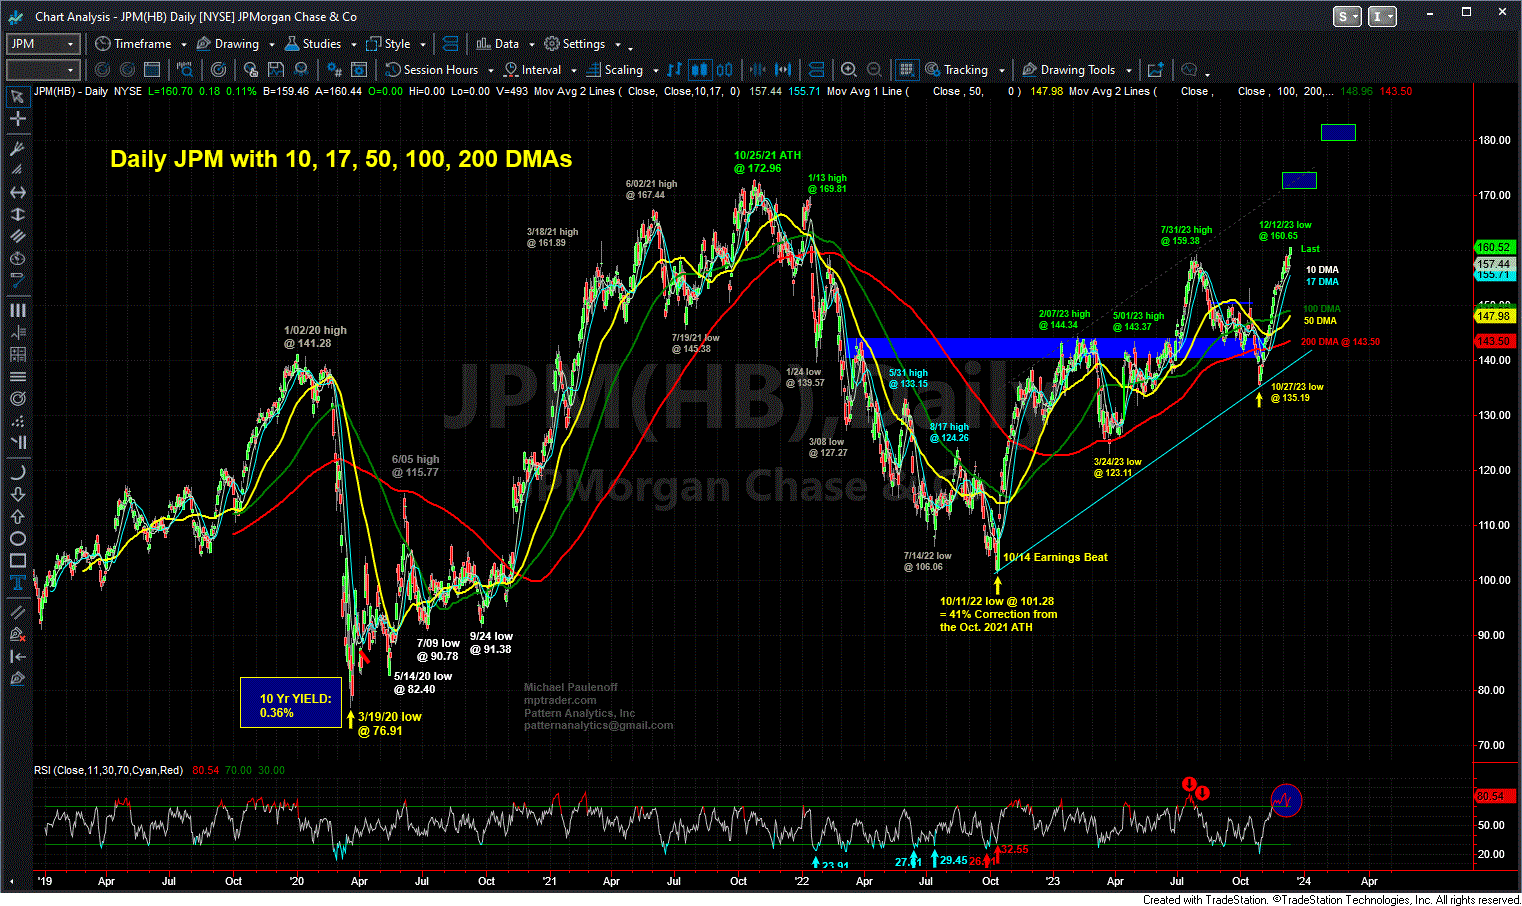
In the banking sector, JPM has been on a tear from its October pivot low at 135.19 (see my attached chart) to yesterday’s high at 160.65 (+19%) that rivals the October-December advance in AAPL! Based on my pattern and momentum work, the fact that JPM hurdled its July 2023 high is a very powerful signal that more upside is directly ahead into the low 170 area next. Only a sudden sharp downside reversal that closes beneath 152.00 will take the wind out of JPM’s sails…
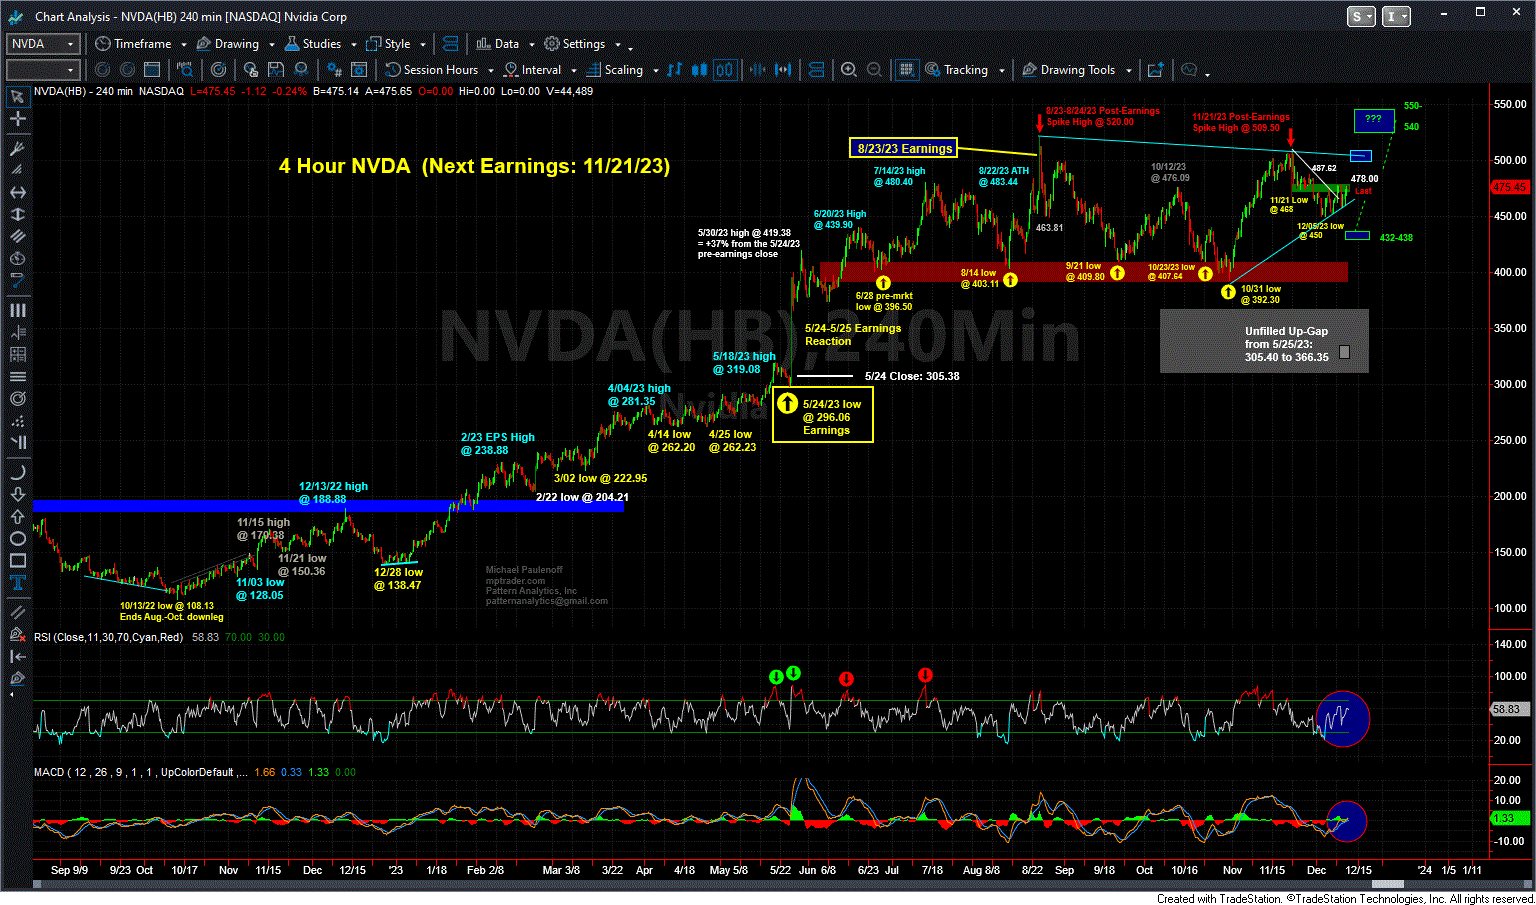
What about NVDA (another one of the Magnificient 7)? NVDA has climbed as much as 30% off of its 10/31/23 corrective low at 392.30 into its 11/21/23 post-earning peak at 509.50, prior to entering a correction that appears to me to have run its course into last week’s corrective low at 450.00 (-12% from its 509.50 high), and now is poised for upside continuation to retest the 500 to 510 prior high resistance zone. In other words, unless NVDA rolls over and breaks below 450.00, it has room on the upside…
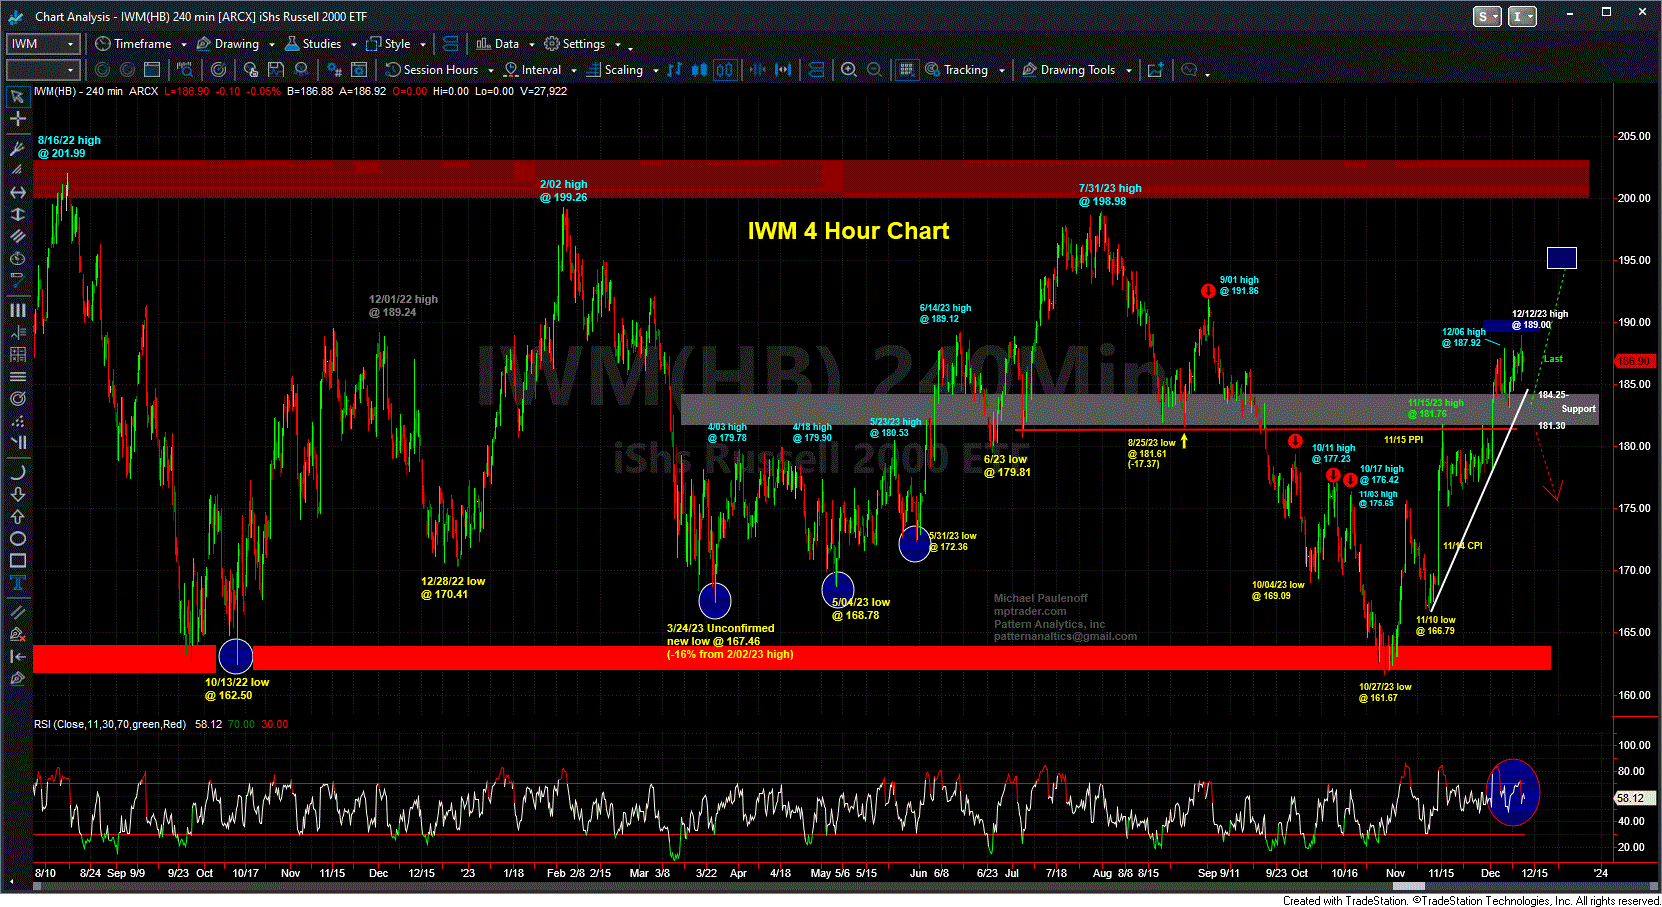
Meanwhile, the Small Caps have joined the October-December melt-up, with IWM gaining 17% (see my attached IWM chart). As long as any forthcoming weakness is contained above key support at 181.30 to 184.25, IWM has unfinished business to the upside into the vicinity of 195, or 4% above current levels…
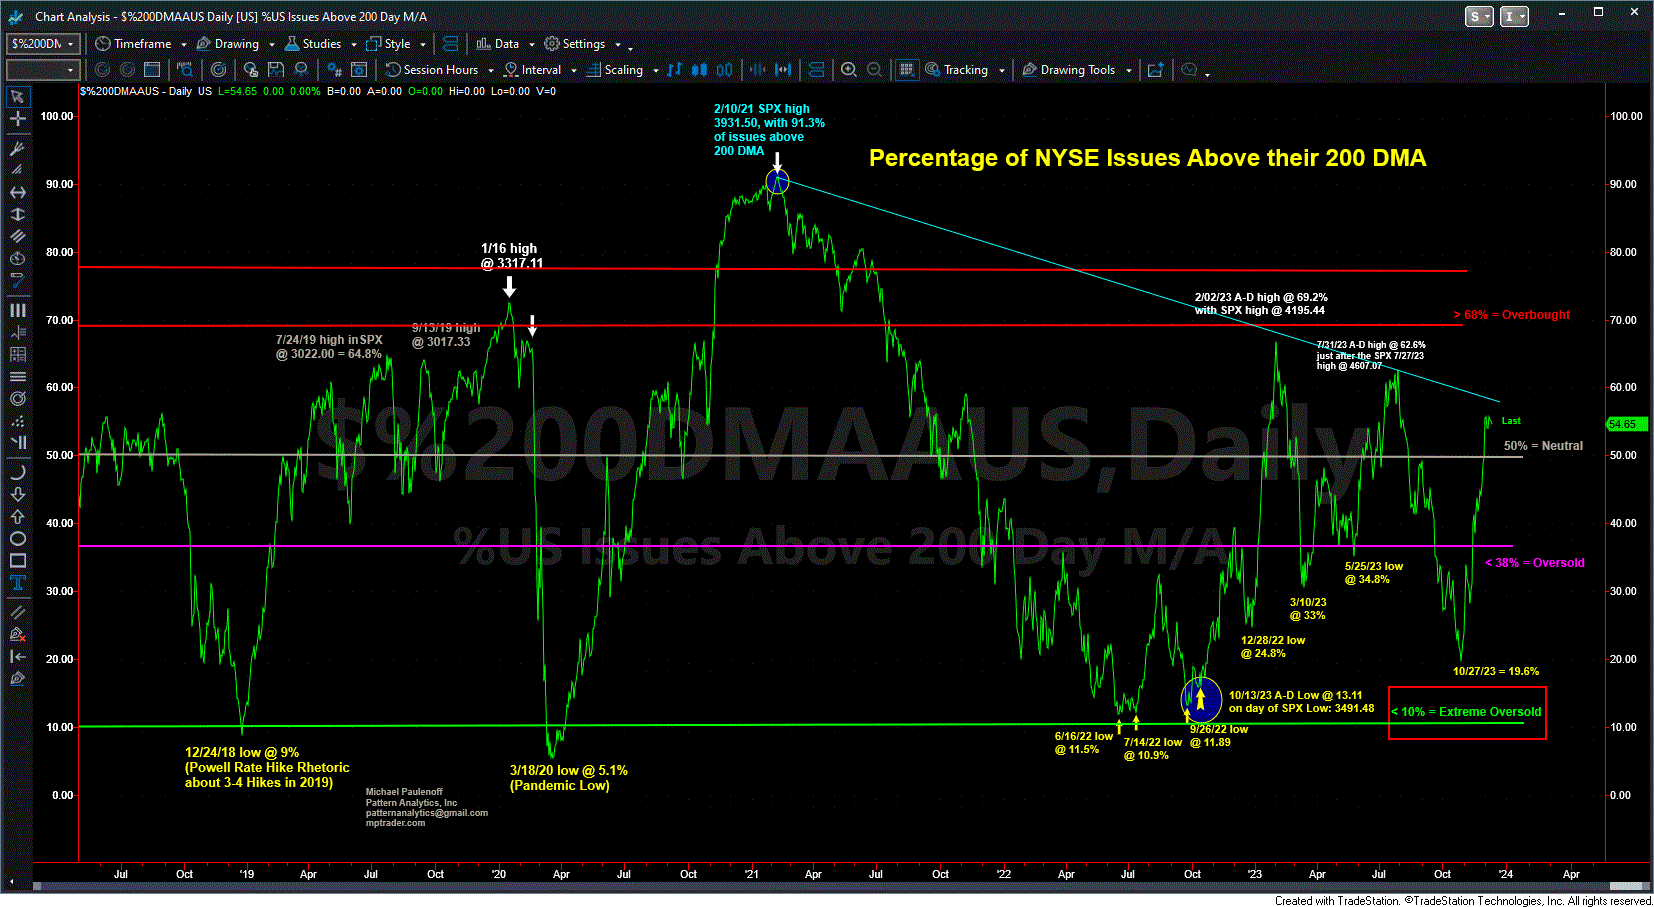
In my previous posts, we discussed a measure of Market Breadth— The Percentage of NYSE Stocks Above Their 200 DMAs, which had not reached frothy levels (see my attached chart) suggesting conditions akin to “too much of a good thing.” As of yesterday’s close, the Percentage had climbed to a Neutral reading of 55%, implying that there IS more room for a higher percentage of NYSE stocks to claw their way above their respective 200 DMAs. Maybe this time will be different, but more often than not, this time is the same or similar, which means I am giving the benefit of the doubt to this breadth gauge climbing closer to 70% before it registers upside exhaustion. For that to happen, the broad rally should continue for a while longer…
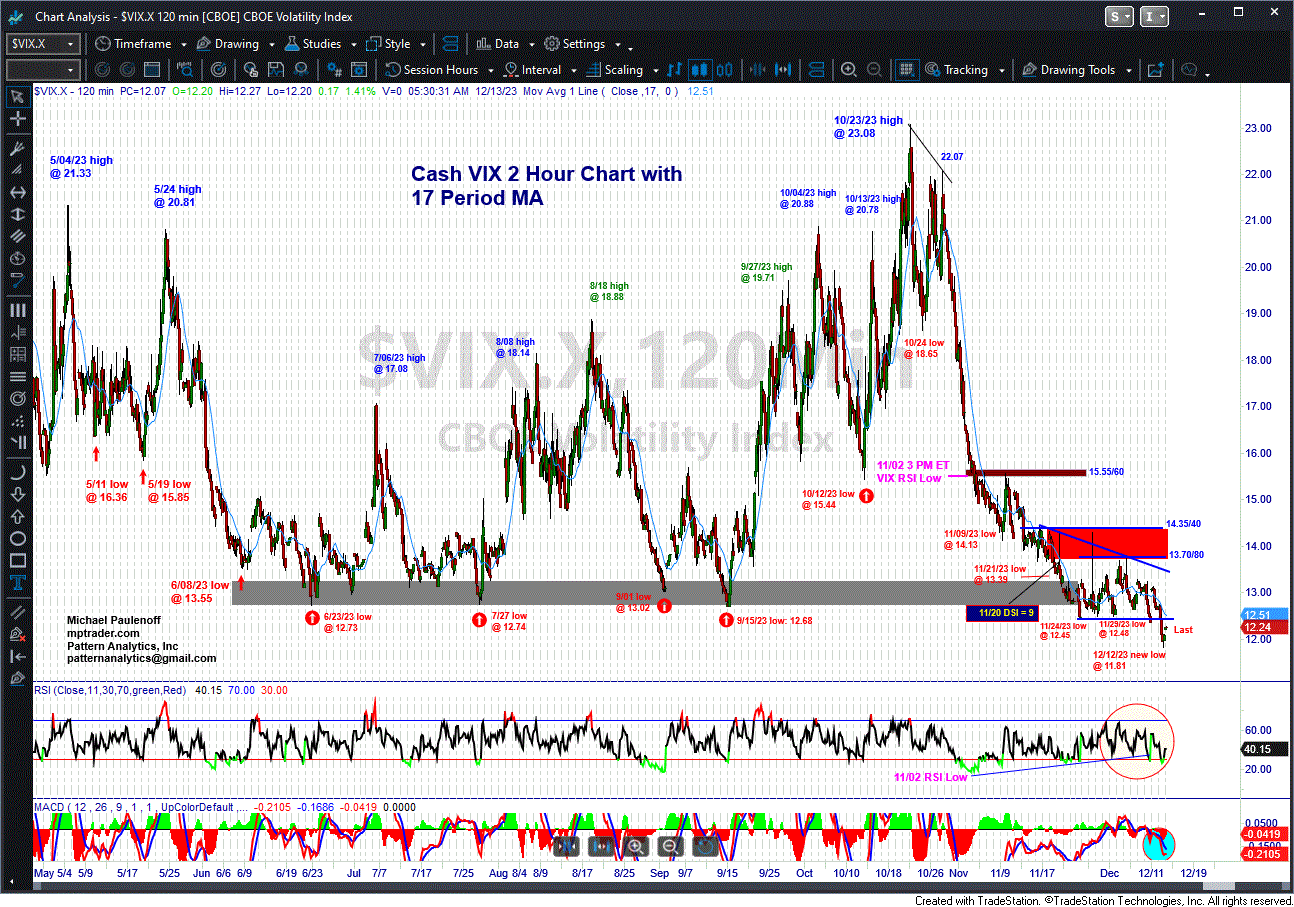
Finally, the Cash VIX, which IS problematic at sub-14 levels (in fact, VIX made a near 3-year low yesterday at 11.81!) shown on my attached chart, and is warning investors that there is a frothy bull market in complacency in progress and that increasingly, there is a volatility shock approaching, probably sooner than later. VIX is urging investors to take out an insurance policy (in the form of VIX Calls or SPY Puts for instance) “just in case” the Fed, or some outlier tail risk suddenly emerges that triggers a scary market exodus. VIX in and of itself is NOT screaming fire in a crowded theater, but it is alerting investors to the prospect of a two-way, very volatile market in the days ahead— something that we have not seen since the end of October.
From our little exercise on the morning of Fed Day, my conclusion is that unless the Fed decides to become the immovable force that is more powerful than the power and upward trajectory of the October-December advance, additional strength in the market and in many individual stocks and major market ETFs has unfinished business on the upside before reaching conditions of bullish exhaustion that will usher-in a correction of some magnitude.
That said, Cash VIX is encouraging investors to protect their portfolios via some sort of insurance policy (options, or scale-up hedging program) against an acute downside reaction, but is not telling them to abandon their positions.
Let’s see what the Fed has in store for the markets this afternoon....
Michael Paulenoff
12/13/23
