Nov Retail Sales Mixed, ES In High-Level Digestion, and Teva Follows Bullish Price Path
Good Tuesday Morning, MPTraders! December 17, 2024-- Pre-Market Update: November Retail Sales were a mixed bag (see bullet points below)... Markets pause before tomorrow afternoon's FOMC Policy Statement and Powell Presser... TEVA Pharma follows the bullish price path we discussed earlier this month...
- Fueled by motor vehicle sales, retail sales climbed 0.7% M/M to $724.6B in November, topping the +0.5% consensus and accelerating from 0.5% in October, according to U.S. Census Bureau data released on Tuesday.
- October's retail sales were revised up from +0.4%.
- Core retail sales, which excludes motor vehicles and parts, increased 0.2% M/M, missing the +0.4% consensus, and unchanged from +0.2% prior (revised from +0.1%).
- Retail sales, excluding autos and gas, also rose 0.2% M/M vs. +0.4% consensus and +0.2% prior (revised from +0.1%)... From Seeking Alpha
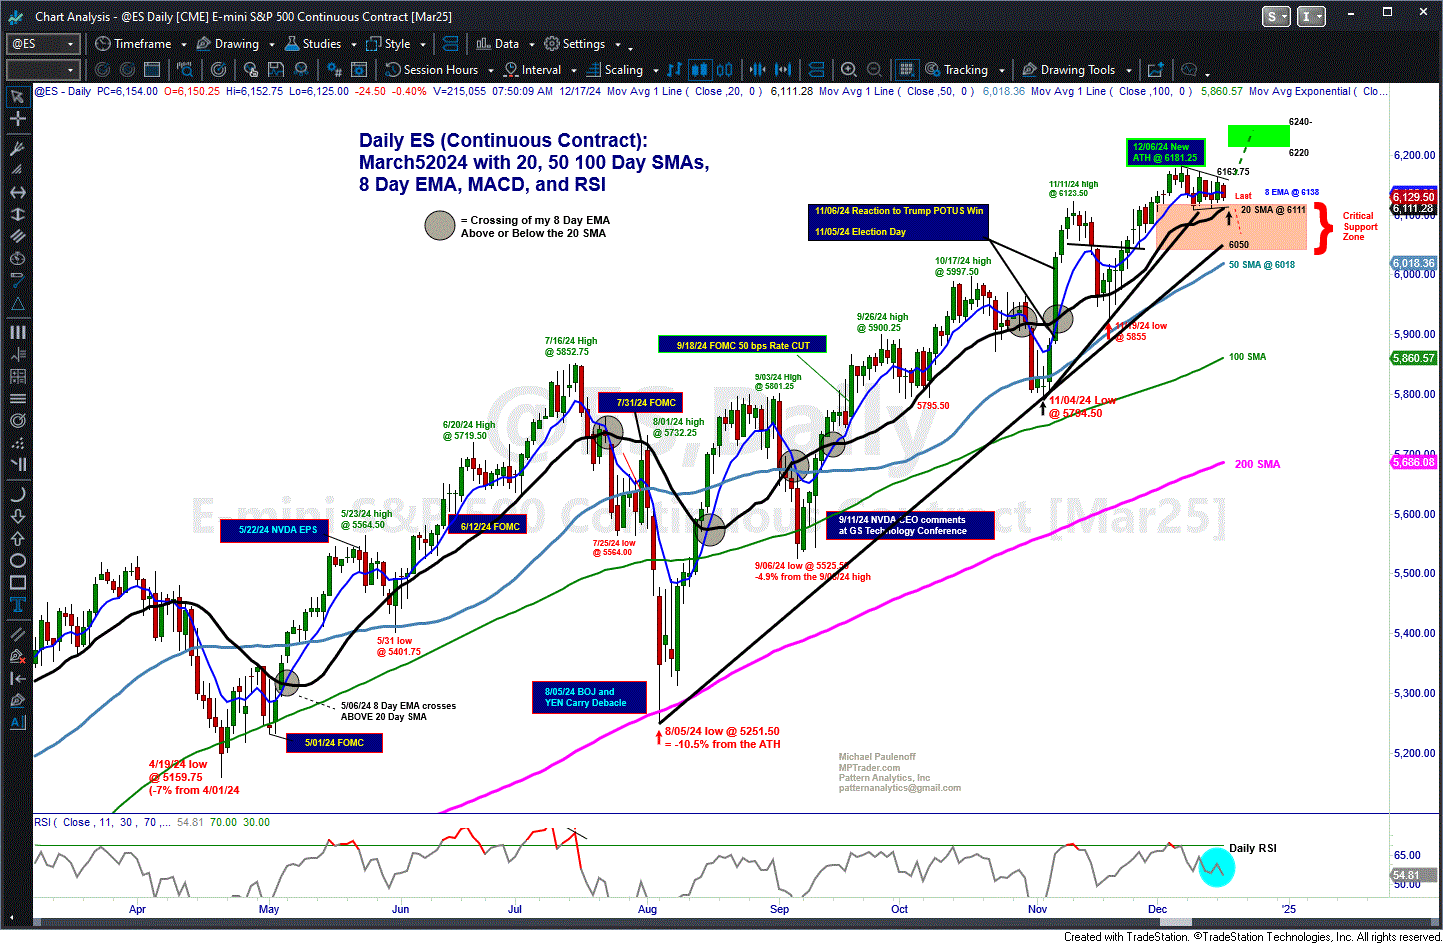
From a Big Picture perspective, we see on my attached Daily Chart that ES is entering its 8th session within the grasp of a high-level bullish digestion pattern (Bullish Pennant formation) off of its ATH at 6181.25 on 12/06/24.
Bottom Line: Unless and until a bout of weakness presses ES beneath critical support lodged between 6050 and 6110, my pattern work argues for upside continuation to new ATHs projected next into the 6120/40 target zone. The $64,000 question is whether or not tomorrow's Fed Day festivities will prove to be the directional catalyst that EITHER propels ES to new ATHs OR rolls the index over into a near-term top? The Answer: Yes and yes! My bias is for upside continuation until proven otherwise... Last is 6131... (Continued below the ES Chart)...
TEVA Pharma is up 20% this morning owing to a positive reaction to drug results. We last discussed TEVA on December 2nd:
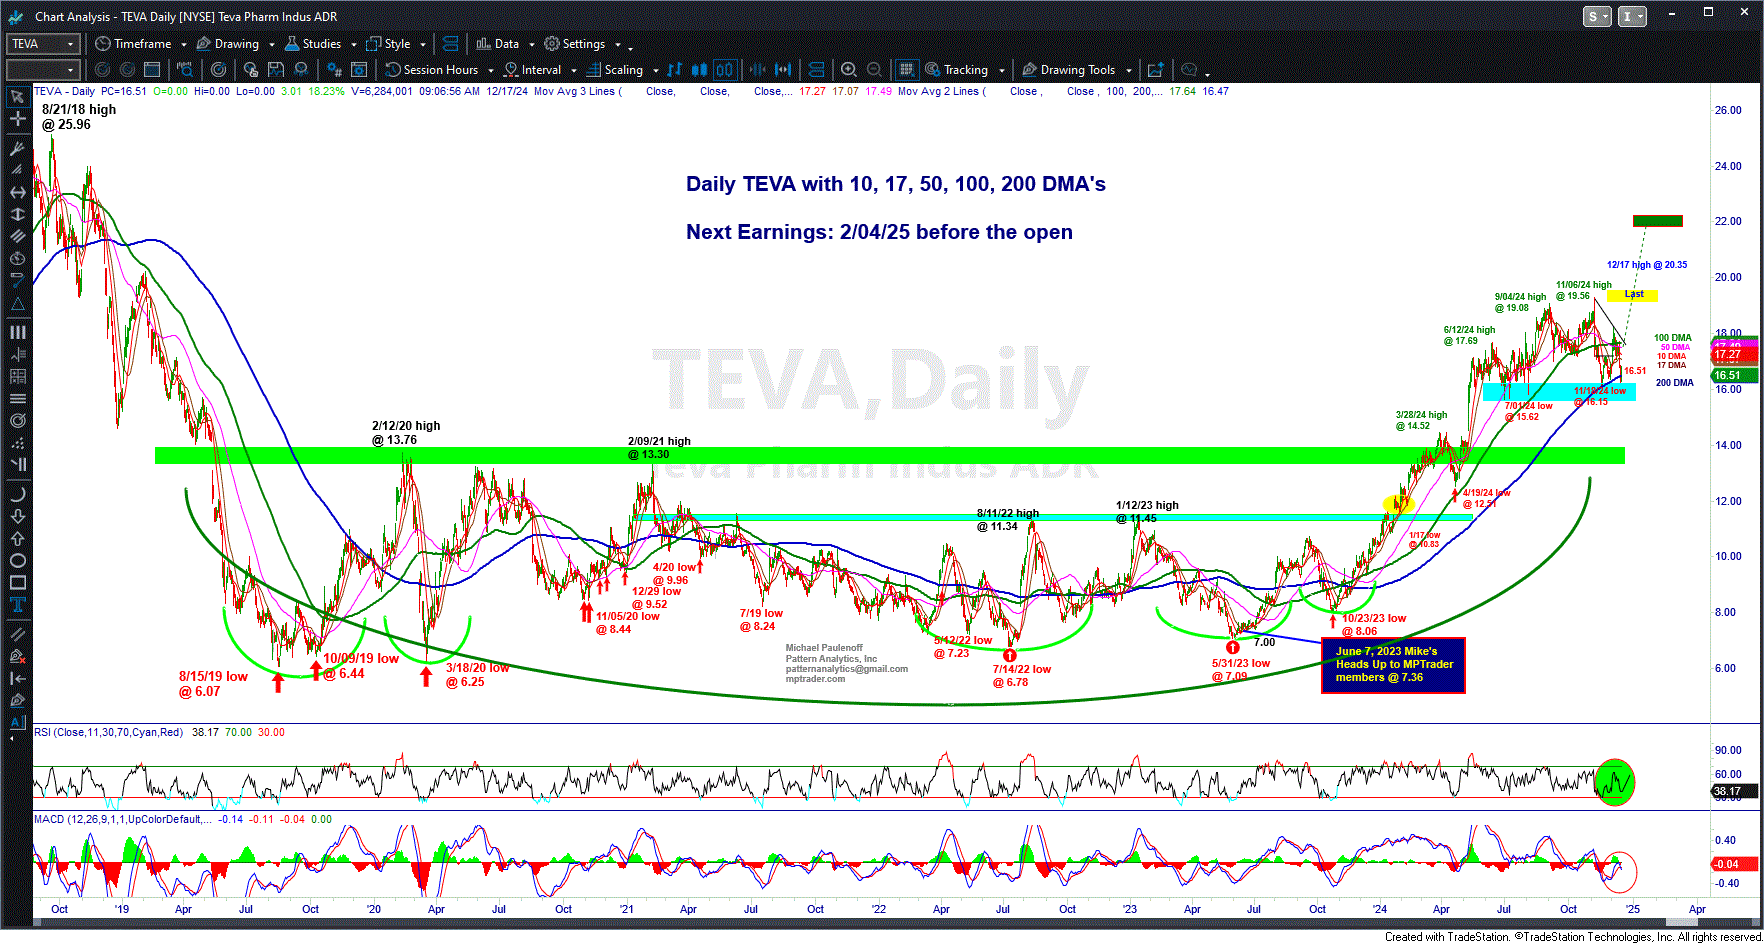
Fellow member Joel-Nathan has asked for a technical update in this name that we participated in from mid-2023 to mid-2024, during which time TEVA rocketed from 7.00 to 17.69 (6/12/24). Since then, we have not missed much, HOWEVER, that might be about to change in a big way in the days directly ahead if my preferred technical scenario unfolds according to my currently promising setup work. TEVA has the right look of completing a major correction at its 11/19/24 low of 16.15 off of the 11/06/24 five-and-three-quarter-year high at 19.56 (-17.5%). In fact, my pattern work argues that the "orthodox high" occurred on 9/04/24 at 19.08 and that the corrective process spanned all of September into late November (16.15). In any case, my pattern work indicates that after probing and holding three times above its up-sloping 200 DMA, now at 16.27, TEVA is poised for upside acceleration provided it hurdles and sustains above 17.15/20 (see my attached Daily Chart)... For now, TEVA is poised for a resumption of its dominant bull trend that commenced after the 6/31/23 low at 7.09 that projects to a retest of 19.40/60 in route to 22.00/50... Last is 16.79...
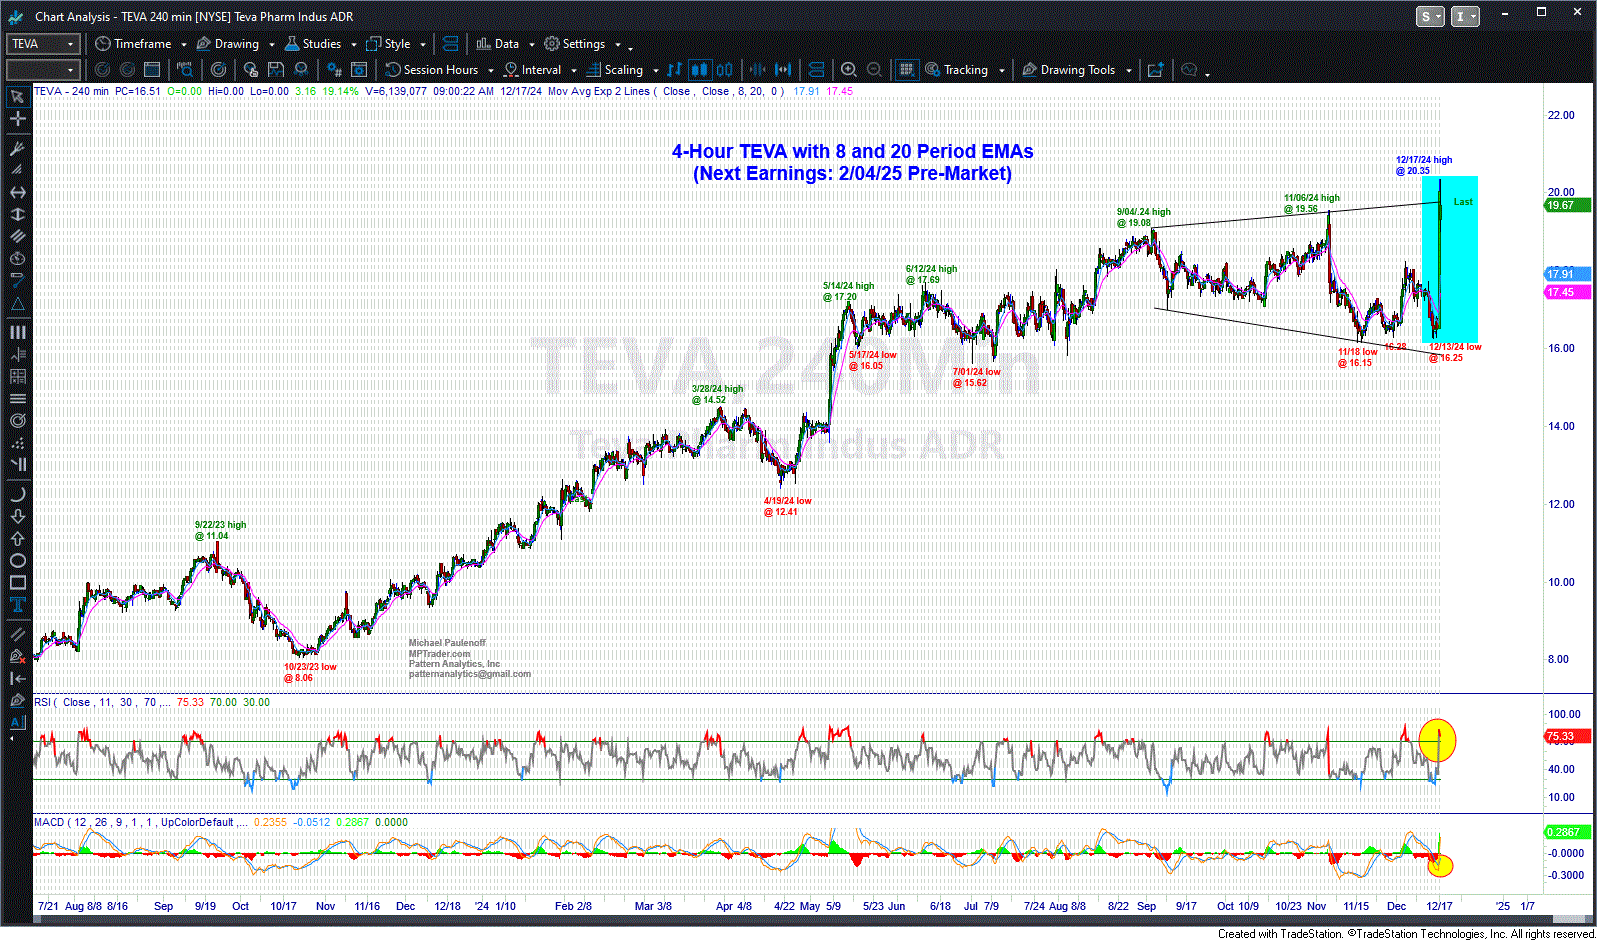
We see on my attached 4-Hour Chart that TEVA has rocketed to a pre-market high at 20.35 in route to my optimal target window of 22.00-22.50, shown on my attached Daily Chart... Any forthcoming weakness into the 18.30-18.80 area should be considered an entry opportunity ahead of upside continuation toward 22, in route to a challenge of TEVA's 2018 high-zone of 25 to 26... Last is 19.68...


