Markets Anticipating Lower Rates
Good Thursday Morning, MPTraders! March 7, 2024-- Pre-Market Update: Economic Data: Weekly Jobless Claims... Powell's Second Day of Testimony on Capitol Hill (10 AM ET)... Earnings of Note after the close: AVGO, COST, MRVL, MDB, DOCU, PBR, GPS... POTUS State of the Union Speech (9 PM ET)...
What can we say about Powell's first day of testimony on Capitol Hill? In a word, uneventful, however, the market's reaction to an otherwise uneventful "Fed event" was anything but uneventful: Stocks rallied, bonds rallied (yields fell), the US Dollar weakened, the precious and industrial metals rallied!
Hmm... Is there a message from the markets here? It certainly seems that across the board, the markets are anticipating lower rates ahead and continued disinflation (at least for the next 1 to 2 quarters), regardless of what Powell would like investors to believe (i.e., higher for longer, or until he receives additional data that makes him "more confident" that official inflation is pressing toward the Fed's 2% target window)...
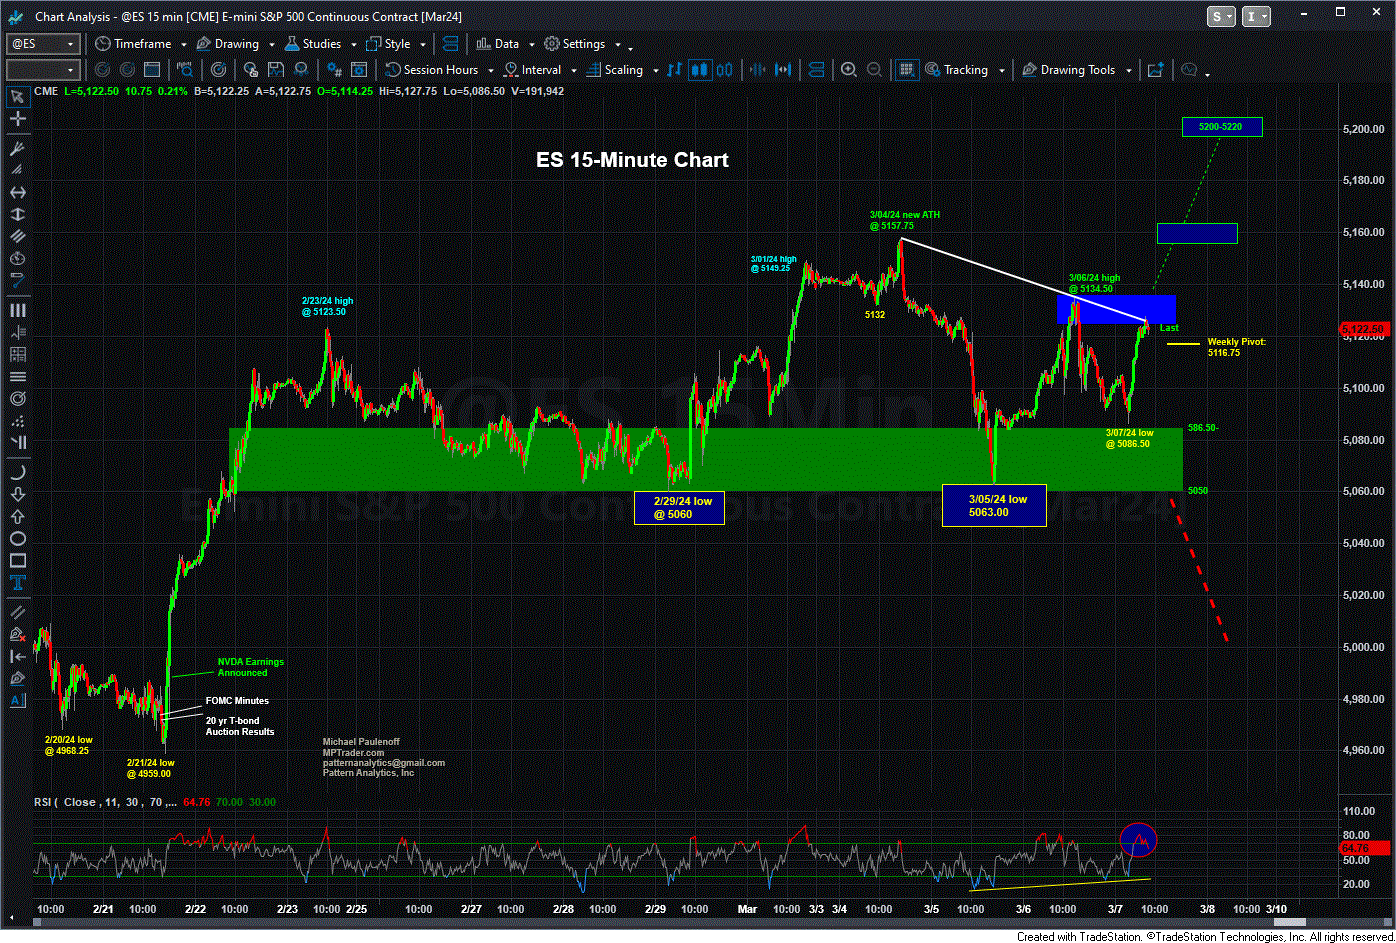
This AM we find ES following the script that we discussed yesterday afternoon, namely that Tuesday's (3/05) low at 5063 ended a near-term pullback from the ATH at 5157.75 (3/04), and that as long as 5063 contains any forthcoming weakness, my pattern work considers ES in the grasp of a new upleg. My attached 15 minute Chart argues that the rally from 5063 to yest's (3/06) high at 5134.50 ended the first upmove of a new upleg, followed by a pullback to 5086.50, which has been followed by this AM's pre-open strength to 5125, where ES is challenging its nearest-term resistance line off of the ATH, which if hurdled and sustained, should unleash a potent upside follow-through that makes a run at new ATH that projects ES toward 5200 next. Only a sudden bout of weakness that presses below 5086.50 will compromise the promising setup heading into Jobless Claims data at 8:30 AM ET and thereafter, into Powell's 10 AM ET testimony before the Senate Banking Committee.
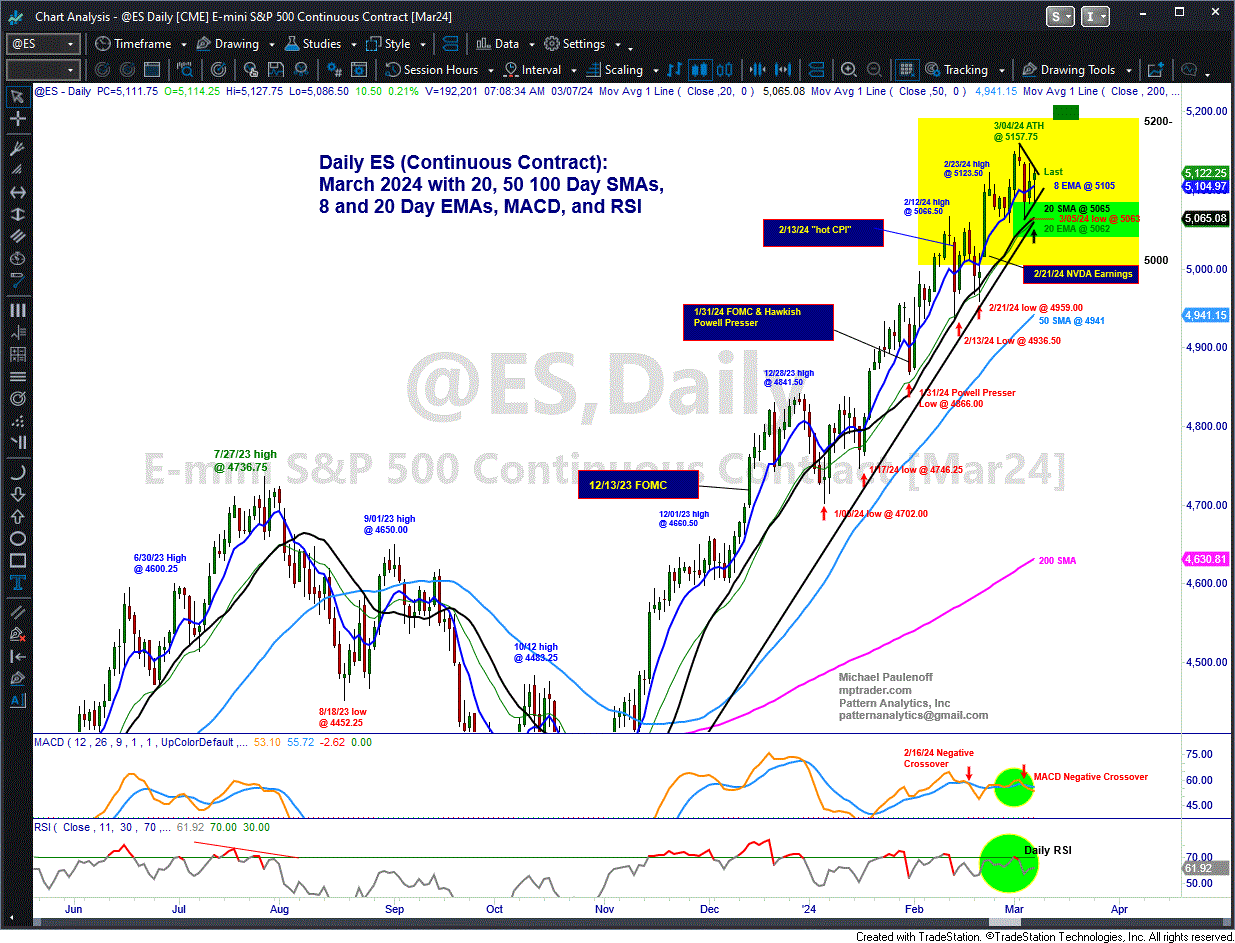
From a Big Picture perspective, my attached Daily Chart argues that all of the action off of the ATH at 5157.75 is setting up as a high-level bullish digestion period ahead of upside continuation toward 5200. From my Big Picture perspective, powerful consequential trendline and MA support are clustered in and around 5060-5065 (reinforcing my near-term pattern setup), which must contain any forthcoming weakness to avert triggering a significant sell signal in my work... Last is 5124... (Continued below the ES Charts)...
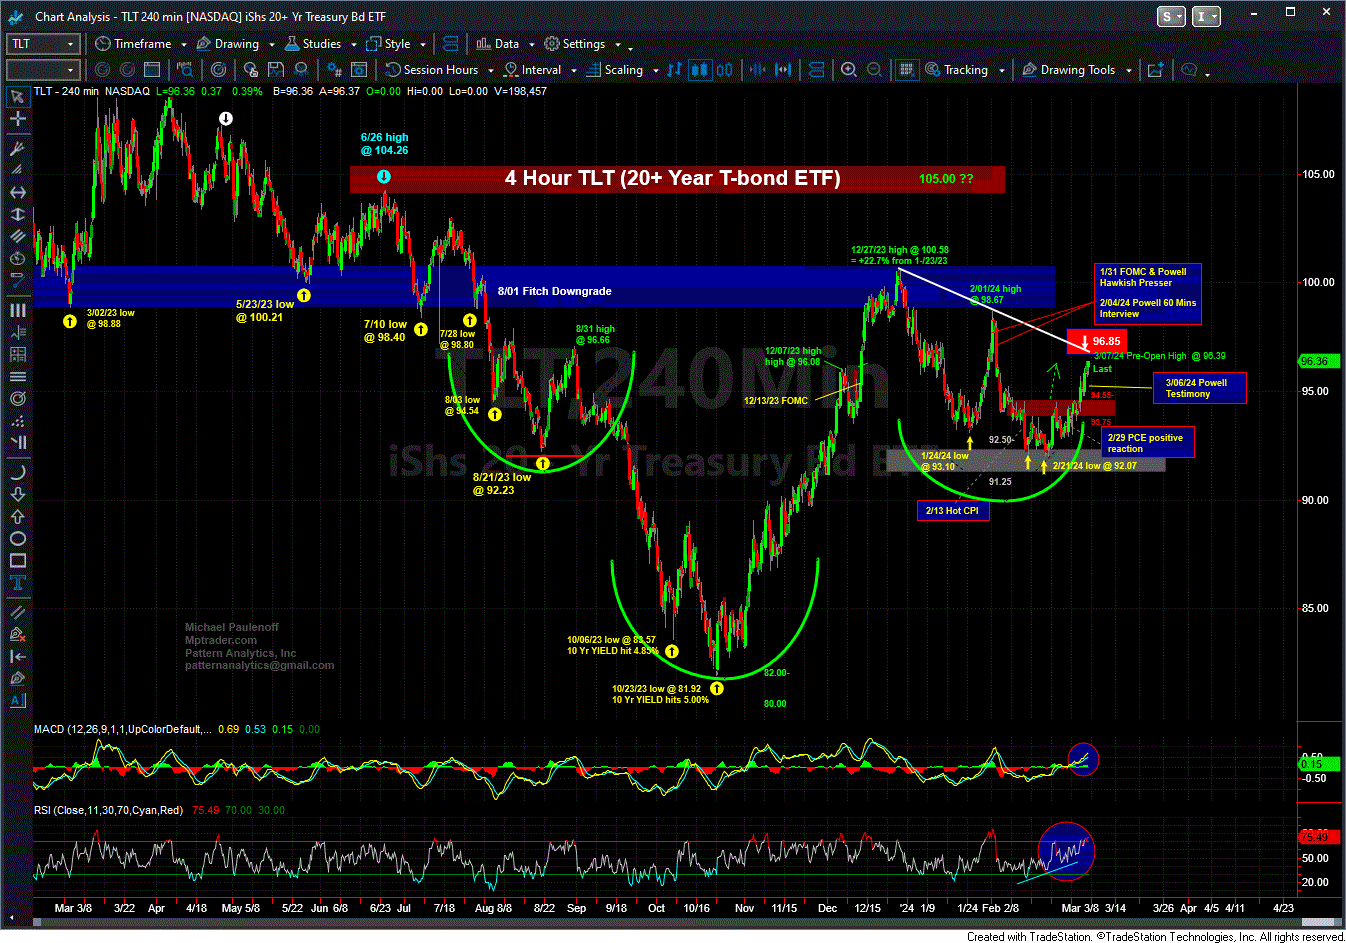
The bond market-- as represented by my attached 4-hour TLT Chart (20+ Year T-bond ETF) continues to claw its way higher from its 2/21/24 corrective low at 92.07 to this AM's pre-market high at 96.39 (a move associated with a decline in 10-year Treasury YIELD from 4.35% to 4.09%). From a wider lens perspective, all of the price action in TLT since last August has the right look of a potentially powerful base-accumulation period and pattern that is propelling TLT toward a challenge of multi-month resistance lodged from 98.70 to 100.60 that if taken out will unleash much higher bond price potential (lower YIELD potential).
Whatever the TLT pattern and price action are discounting or anticipating fundamentally is debatable, but it sure does look like lower interest rates are directly ahead... Last in TLT is 96.36...


