Eye on Earnings and Market's Election Expectations
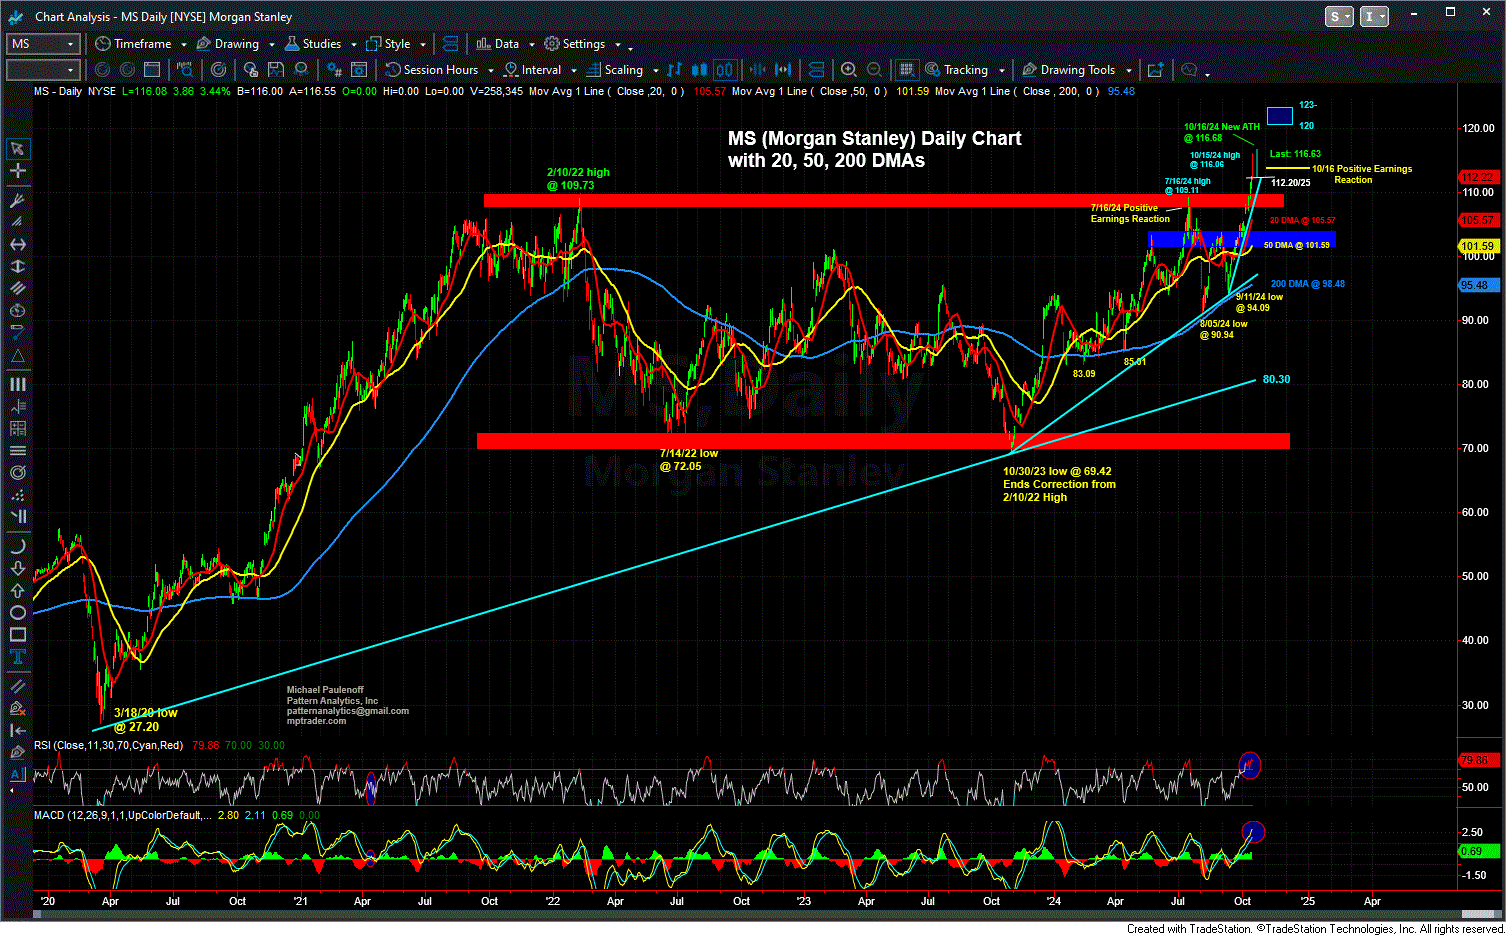
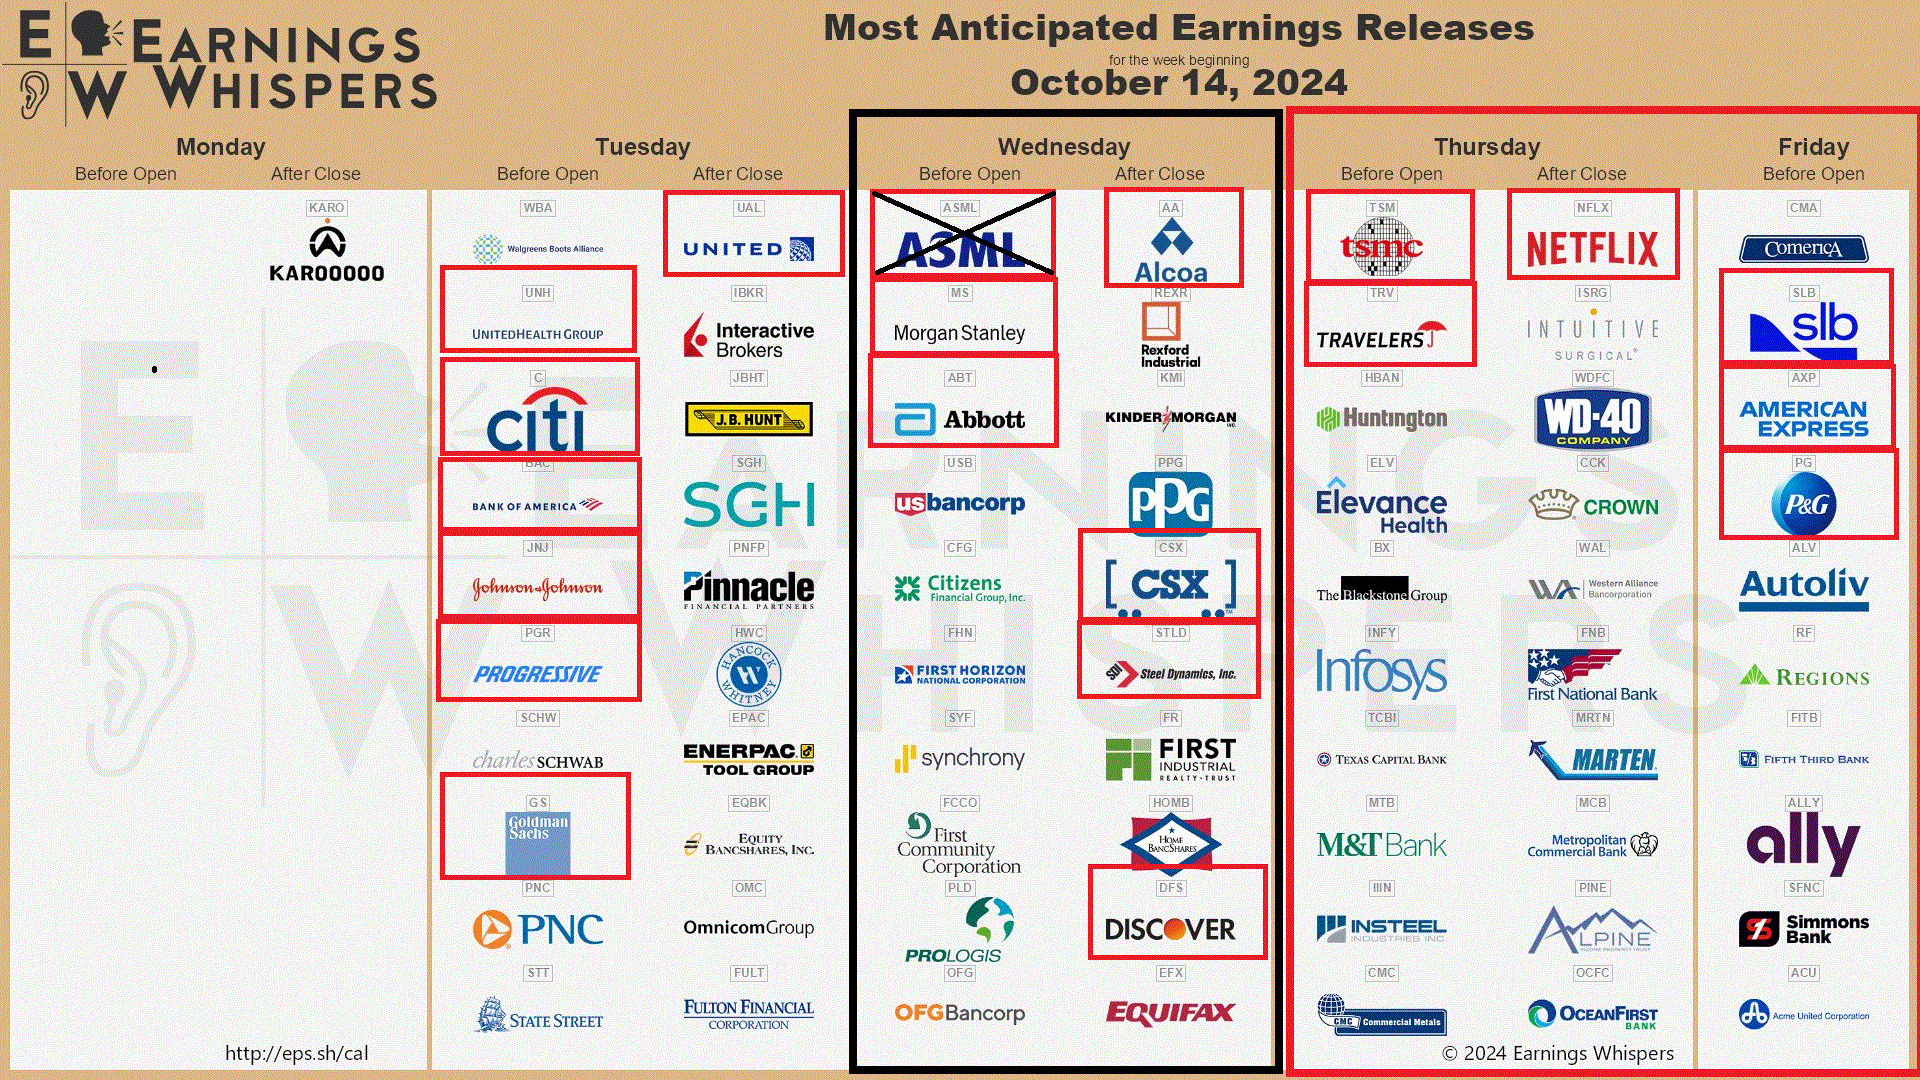
Good Wednesday Morning, MPTraders! October 16, 2024-- Pre-Market Update: Earnings: Morgan Stanley blew away The Street's Estimates. The stock has popped 3.5% to a new ATH high at 116.68 (see my attached Daily Chart), and points next to a Target Zone of 120-123. Only a decline and close beneath 112.20 will compromise the bullish setup... Last is 116.37 (continued below the Earnings Calendar...
Presential Politics and DJT (Trump Media and Technology Group): Yesterday, fellow member Dude mentioned the crazy price action in DJT. Here is my previous post about DJT from 9/25/24:
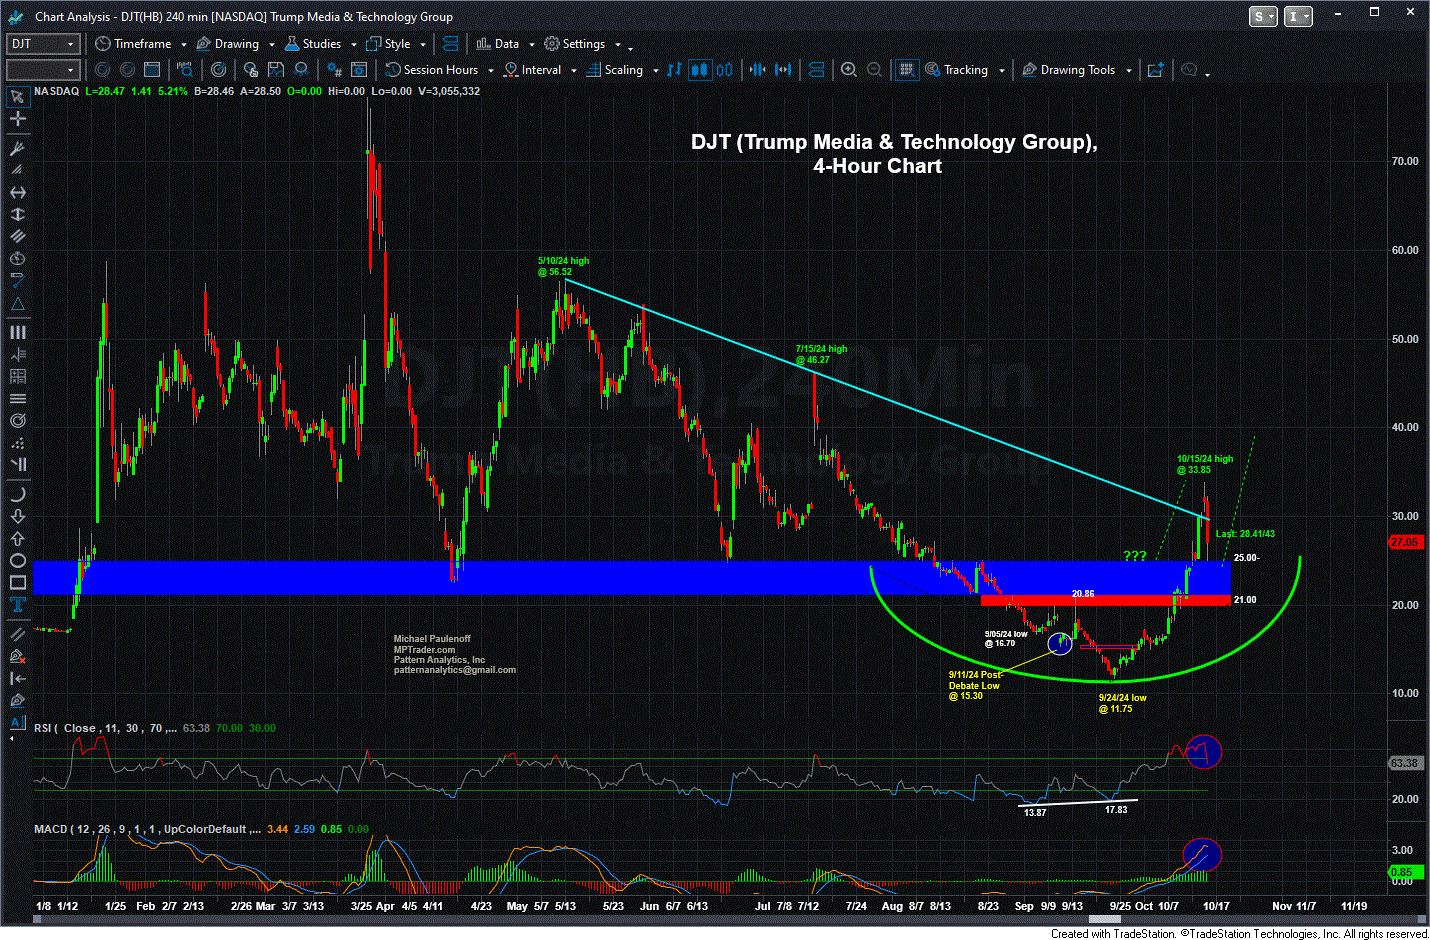
DJT rolled over to the downside two days after The Debate, and proceded to plunge to unconfirmed new lows at 11.75 yesterday, before bouncing today. To regain upside traction, DJT needs to climb and sustain above 15.30/80, which will point the stock at 19.00 to challenge its nearest-term down trendline. I post this chart to keep an eye on how investors are "voting" for The Donald's prospects of reelection, or not! So far, investors have kept 45 in a serious downtrend pattern not indicative of a winning campaign... A climb above 19-21 ahead of the election will inflict damage to the downtrend. Last is 13.86...
Fast-forward to this morning. We see DJT has climbed from its 9/24/24 low at 11.75 to yesterday's high of 33.85 (+189%) and is attempting to push through and SUSTAIN ABOVE a consequential 5-month resistance line in the vicinity of 29.80 that if accomplished, will trigger a next target of 40. My post-September pattern work views DJT as a bottom formation and if so, any forthcoming weakness should attract renewed buying interest from 25 down to 21.
Who cares? Chart patterns are psychological representations of investor (mass) psychology. From that perspective, DJT has climbed nearly 25% from below the price on the debate date (9/10) to as much as 35% above the debate date, suggesting that DJT (the candidate) has overcome the fallout from the debate and perhaps also that his prospects of winning the election have improved markedly as well.
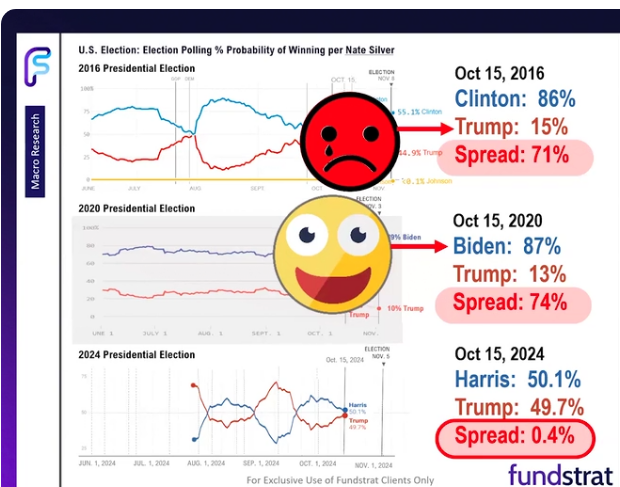
Finally, look at the polling graphic attached below the chart, which comes via Tom Lee's site, Fund Strat. He makes the point that on 10/15/16 and 10/15/20, Nate Silver's Probability of Winning Model overestimated the chances of the Democrats winning the presidency, and thus, Tom "muses" that this year, on 10/15/24, if Silver's Model again is overestimating the Democratic probability of success in taking the presidency, then DJT is likely doing betting than Silver's Model currently indicates.
Regardless of who wins, my intellectual curiosity and belief that charts foretell price direction and target projection that pre-date the emergence of background stories (fundamentals) at the moment suggests that with 20 days remaining until the election, Mr. Market could be tilting toward sector winners and losers... and just maybe my sense yesterday afternoon that a subtle flight to safety was unfolding into US Treasury paper, Precious Metals, and Bitcoin (at the expense of equities) is a reflection of the prevailing political winds... MJP


