ES Bends But Doesn't Break
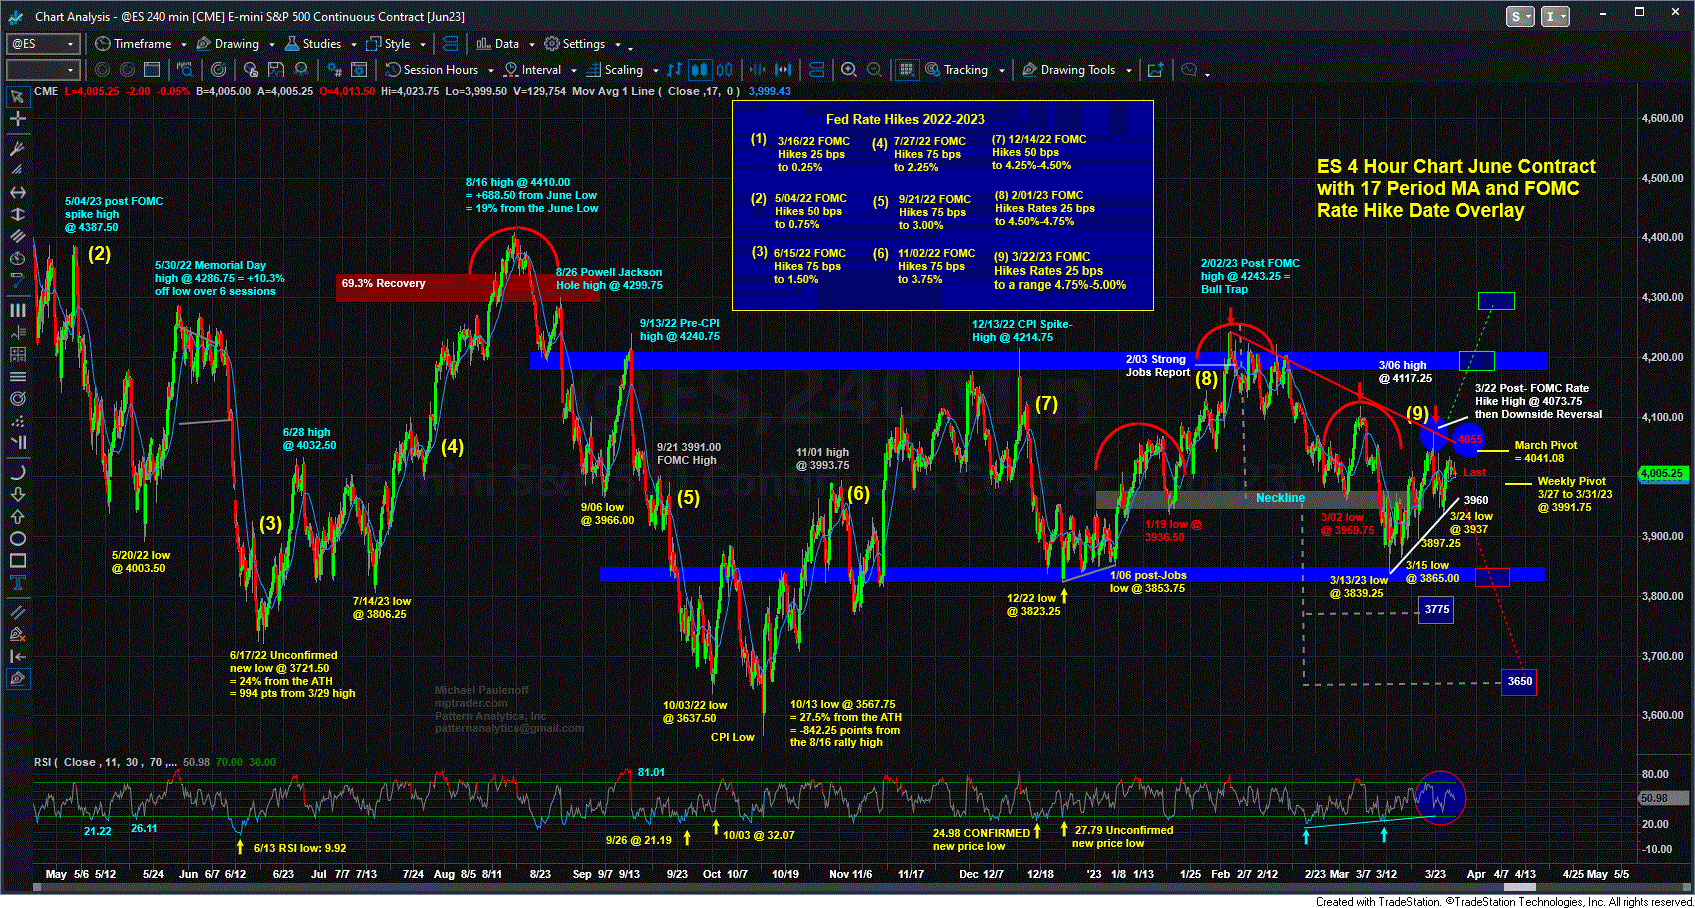
Good Tuesday Morning, MPTraders! March 28, 2023-- Pre-Market Update: Four trading days remain in March and until the end of Q1, 2023, which might be one important factor underlying the buoyancy of the equity indices since last Friday. Then again, one look at my attached 4-Hour Chart shows us that since at least last November, ES has been trading in a range between 4200 on the high side and 3800 on the low side of a range-bound market despite so many potentially powerful directional catalysts, any one of which could have triggered a sustained up or down move.
For example, the regional bank debacle hit mainstream airwaves on the weekend of March 11 and 12, but the KRE (Regional Bank ETF) was feeling jittery starting on March 9 from where it declined 27% into March 13. During that same period, ES declined 5.2% (4050 to 3839) and now is circling 4000, down a negligible 1.1%. As we speak, KRE is still down 27% from March 9.
Clearly, ES bends but does not break. In fact, as we speak, ES is circling 4000, exactly 200 points from the upper boundary line and exactly 200 points from the lower boundary line!
What will propel ES up or down 200 points to take out the upper or lower boundary lines? Unless there is another bank failure, the next significant economic data arrive on Thursday with Weekly Jobless Claims (a high number will indicate the Jobs Market is finally weakening, recession signs intensifying = ES down), and then on Friday, the PCE Inflation report, which could show a significant improvement in price behavior during February (much less inflationary pressures = less Fed impetus to hike again = ES up)...
Meanwhile, we wait and watch for any technically significant price movement. At this juncture, ES needs to climb and sustain above 4055 to gain upside traction. Conversely, a decline that breaks 3960 will trigger downside traction... Last is 4000.25

