Charts on SPY & QQQ
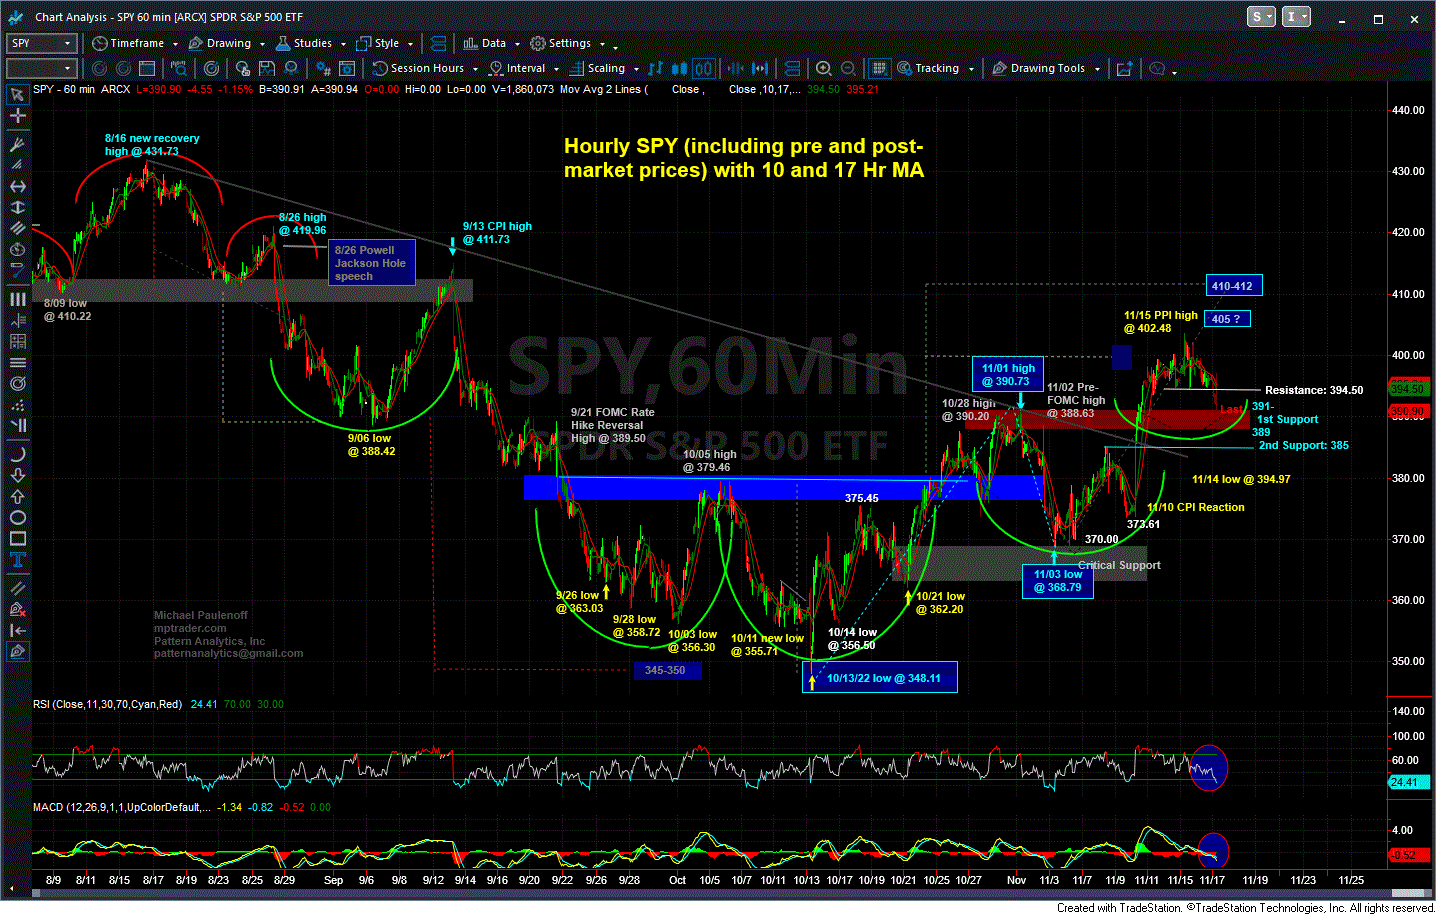
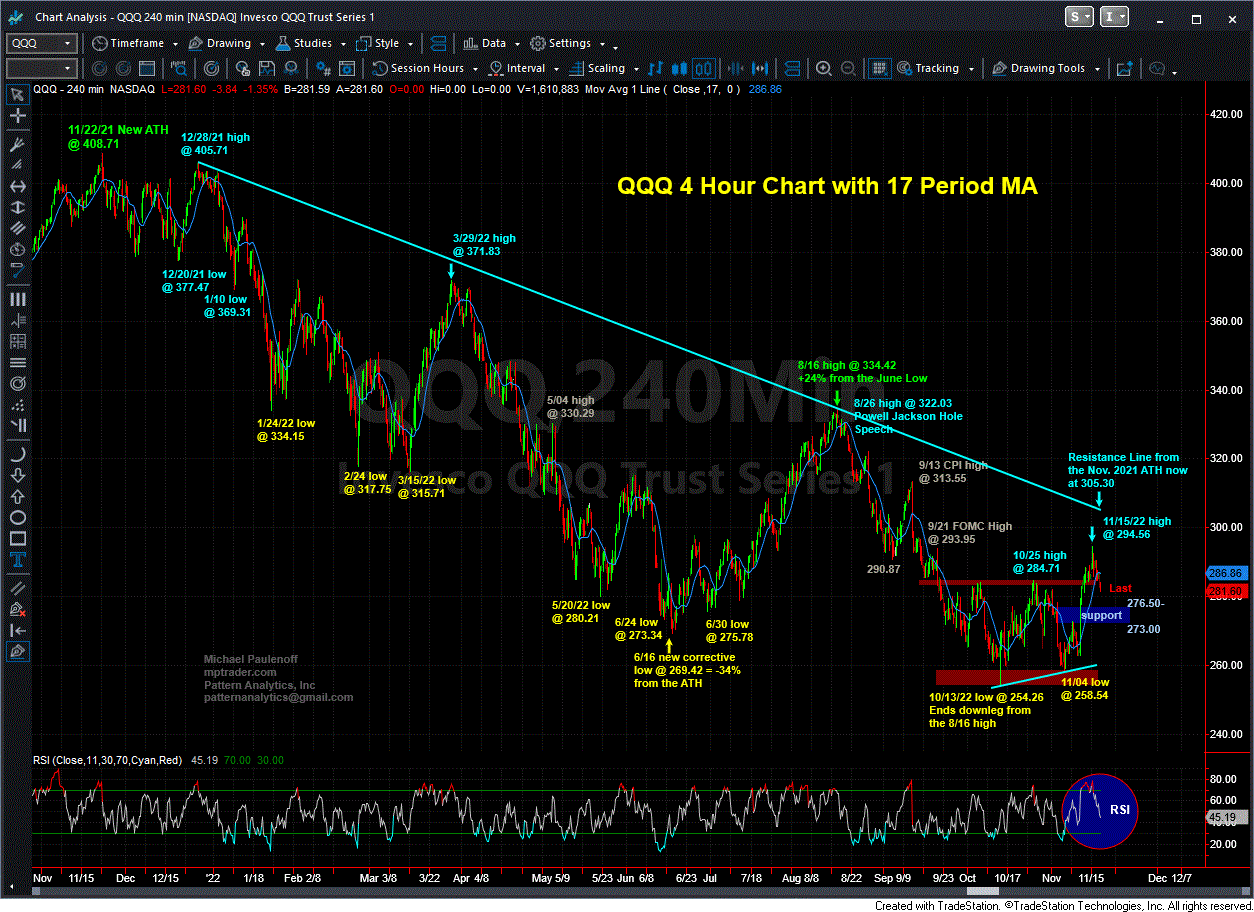
SPY... QQQ... Charts Shown Below...
SPY has violated key three-day support at 394.50, and has pressed to 390.68 so far as it digs into initial support zone from 391 to 389, which must contain the weakness to avert downside continuation to 385 thereafter...Only a climb back above 395.00 regains bullish traction... Last is 390.60...
QQQ has rolled over from Tuesday's (11/15) recovery rally high at 294.56, up 15.8% from the 10/13 pivot low at 258.54, which has the right look of the end of the first part of a developing larger, more complex counter-trend rally that I am expecting to challenge the dominant resistance line off of the ATH that cuts across the price axis in the vicinity of 300-305 during the upcoming sessions.
The key support level that MUST contain current weakness to preserve the larger pattern development for a run at 300 is lodged from 276.50 down to 273.00 (see chart below). A break and close below 273.00 weakens the probability of another loop up toward 300... Last is 281.15


